
sparkDash ⚡ — Multi-unit monitoring dashboard for NVIDIA DGX Spark



by Mia'a AI Lab

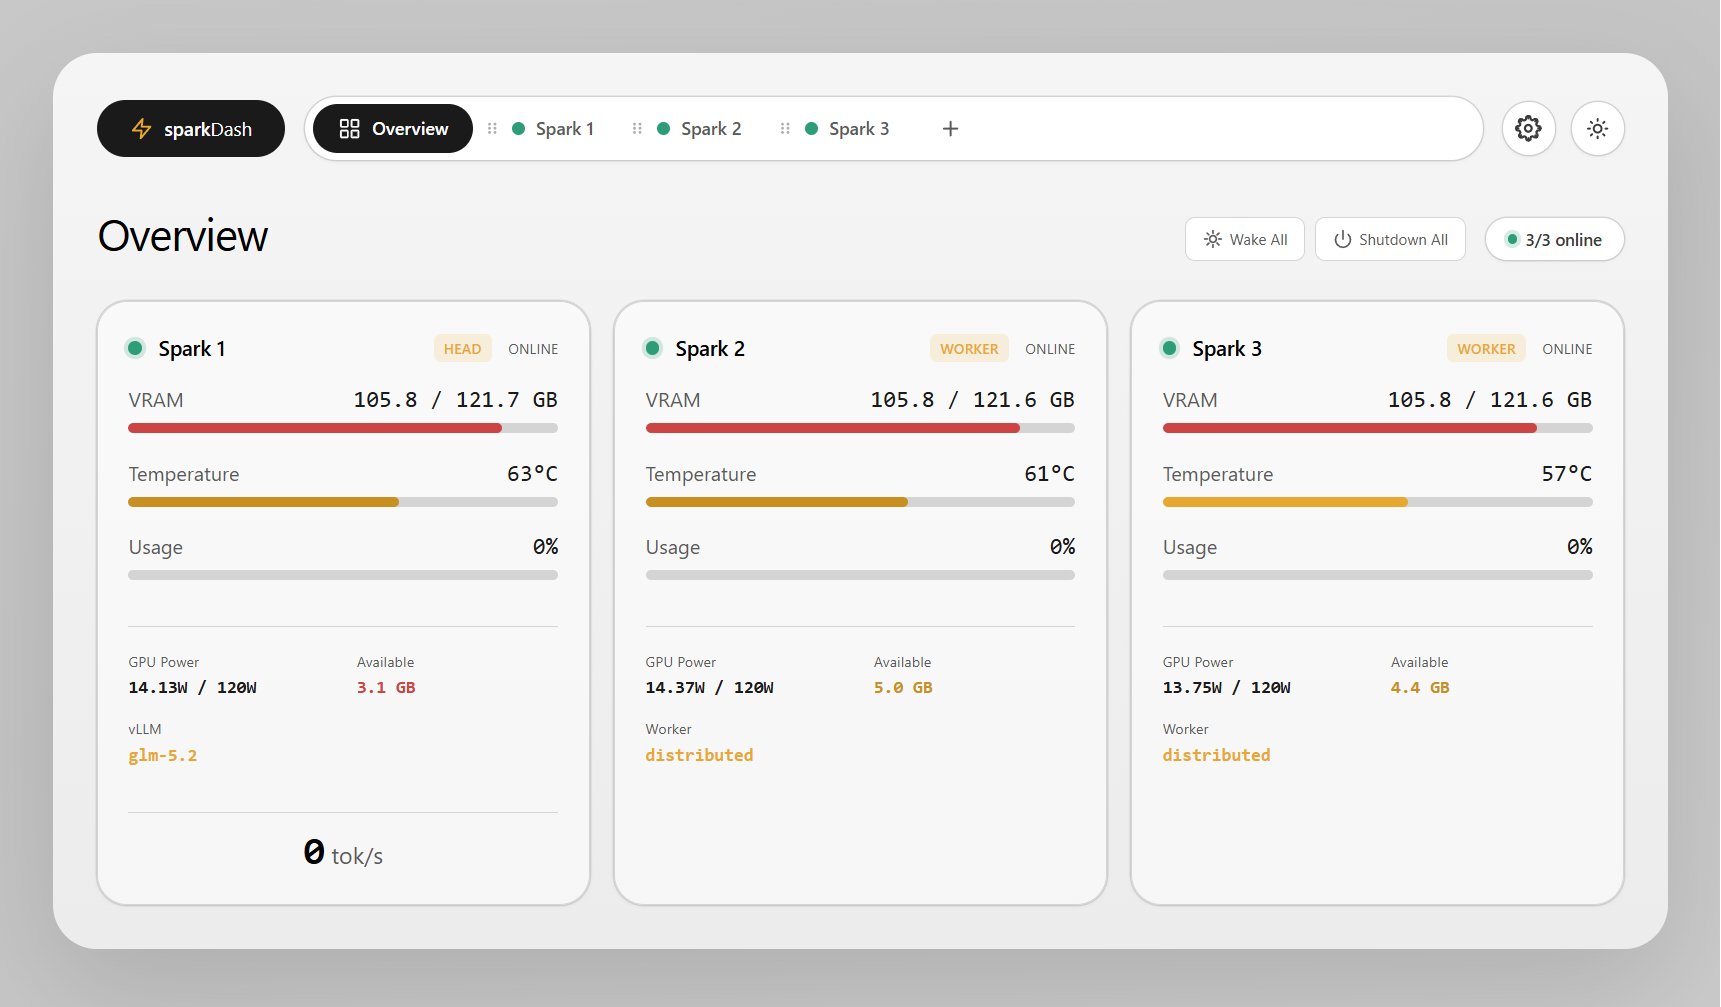
sparkDash is a real-time web dashboard for one or more NVIDIA DGX Spark (GB10) machines in a single browser window. It streams GPU, CPU, unified memory, storage, network, and local LLM metrics — and lets you add, edit, reorder, or remove Sparks from the UI without restarts or code changes.
It also supports non-Spark units: any Linux machine with an NVIDIA GPU (e.g. a workstation with a dedicated RTX/L-series card) can be added as a dedicated GPU host and monitored the same way via SSH and nvidia-smi. For these units the dashboard correctly separates RAM (system memory) from VRAM (discrete GPU memory).
LLM Prompt Showcase
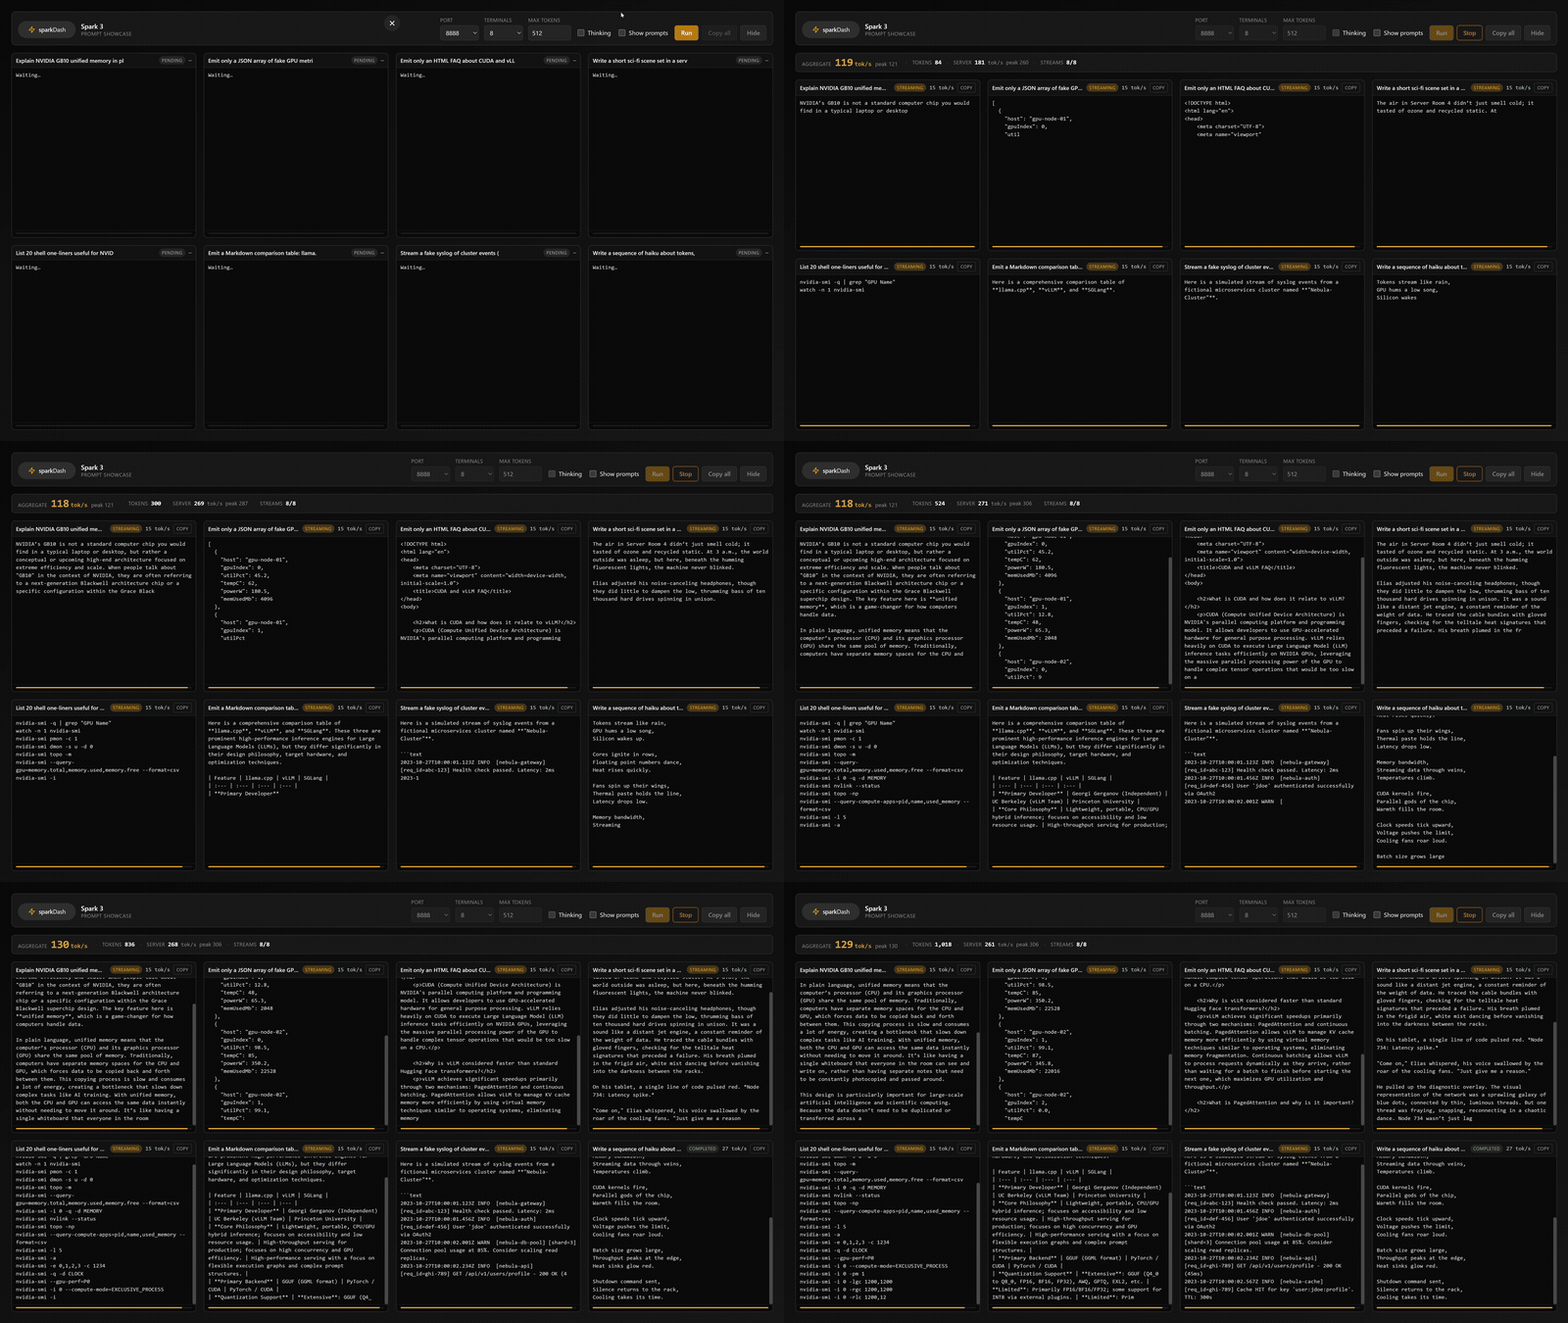
Download MP4 · also in assets/llm-showcase.mp4
Table of contents
- Latest version changelog
- Features
- ComfyUI monitoring
- Hermes Agent monitoring
- Full changelog
- Quick start
- Architecture
- Tech stack
- Repository layout
- REST API
- Configuration
- Security
- Scripts
- How it works
- Contributing
- License
Latest version changelog
Version 1.8.0 — Non-Spark units, prefill, and host RAM/VRAM
- Non-Spark unit support — add a dedicated GPU host (kind
host): any Linux box with an NVIDIA GPU, monitored via the same SSH +nvidia-smicollectors but not labeled as a DGX Spark. Hosts get a detected hardware summary (GPU model / driver / CPU / RAM) and separate RAM vs VRAM panels — VRAM is real discrete GPU memory fromnvidia-smi, RAM is system memory from/proc/meminfo. On the unit page the Resources layout for hosts is GPU in the left column with RAM → Network → Storage stacked in the right column (Sparks keep their original layout). Overview cards add a RAM bar for hosts. - Prefill tok/s next to decode — live LLM panel sparkline, Overview cards as two columns (tok/s | prefill), decode-bench Prefill column (
prompt_tokens÷ TTFT) - Live prefill — vLLM engine-step tokens (including short prefills that share a poll with first decode); ds4 computed prefill diffs; 0 when idle. Shows while the engine is reading the prompt / building KV cache (send or regenerate), not when you only open a saved chat
Version 1.6.0 — ComfyUI monitoring & compact default
- ComfyUI — opt-in per Spark (port 8188): live jobs, progress, last run, cancel, queue ETA, Open on LAN IP, model inventory
- Overview — Comfy status chip (
idle/run/Nq) - Layout — collapsible Resources / Services; LLM + Comfy side-by-side; multi-LLM row rules
- Compact UI — default density (comfortable still in Settings)
Full history: CHANGELOG.md
Features
| Area | What you get |
|---|---|
| Multi-unit | Any number of units; each has a tabbed detail page plus a shared Overview |
| Non-Spark GPU hosts | Linux boxes with a dedicated NVIDIA GPU are first-class units: same nvidia-smi collectors over SSH, detected hardware summary, and separate RAM / VRAM panels. Detail page: GPU (left) + RAM → Network → Storage (right column); Overview cards show RAM and VRAM bars |
| Live streaming | WebSocket metrics with configurable poll intervals; central history store for sparklines across tab switches |
| Local + remote | Host metrics via sysfs/proc/nvidia-smi; remotes over SSH (key or password) |
| LLM probe | Auto-detects llama.cpp, vLLM, sglang, or ds4-server; live tok/s per server |
| ComfyUI | Opt-in probe: queue/jobs, progress, cancel, Open link, inventory, overview chip |
| Hermes Agent | Opt-in per unit: background update check (10 min), status badges, one-click or batch hermes update |
| Decode benchmark | Multi-concurrency streaming decode tok/s (server + per-stream), persisted last run |
| Prompt Showcase | Full-page multi-terminal LLM streaming demo (up to 32 prompts) with live tok/s and copy-out |
| vLLM health | KV cache %, run/wait queue, TTFT/E2E/ITL p95, preemptions, prefix cache, MTP accept from Prometheus /metrics |
| Multiple LLM ports | Monitor several LLM servers on different ports simultaneously — each gets its own panel with independent backend detection and metrics |
| GPU processes | See the top GPU processes by VRAM usage directly in the GPU panel, including process name and memory allocation |
| Spark uptime | System uptime displayed inline on each Spark header for at-a-glance availability |
| Power controls | Graceful shutdown (SSH host script) and Wake-on-LAN; batch actions on Overview |
| Spark roles | Head / Worker / Standalone — worker label + head link; standalone can disable LLM monitoring |
| Unified memory | GB10 128 GB LPDDR5X pool (~273 GB/s), GPU/CPU split, bandwidth via nvidia-smi dmon. Non-Spark hosts show discrete VRAM (nvidia-smi) and system RAM separately |
| Themes | Dark, light, cool white, OLED — neutral palettes, persisted in localStorage |
| Secrets | SSH passwords AES-256-GCM encrypted; never in sparks.json or API responses |
| Docker-first | Single privileged container for host metrics; prod and dev Compose files |
| Hot config | Add / edit / remove / reorder Sparks from the UI with no process restart |
ComfyUI monitoring
sparkDash can optionally monitor a ComfyUI instance on each Spark — the same way it probes local LLMs, but focused on jobs and queue, not a second copy of GPU/RAM bars (those stay on the GPU / CPU panels).
What is supported
| Capability | Details |
|---|---|
| Opt-in per Spark | comfyMonitoring (default off) + comfyPort (default 8188) |
| Any role | Head, worker, and standalone can enable ComfyUI independently of LLM cluster role |
| Liveness | GET /system_stats — online, ComfyUI / PyTorch version, device type (cpu/cuda) |
| Queue / jobs | GET /queue — running + pending items; workflow title, model/LoRA filenames from the graph, footprint (resolution · steps · sampler · batch · node count) |
| Progress | Progress bar on the active job — Comfy WebSocket when events are available; otherwise elapsed / average-duration estimate |
| Last finished job | Status + duration via /api/jobs (fallback /history) |
| Queue ETA | Estimate from recent job durations × pending (+ progress remainder when known) |
| Cancel / remove | From the Comfy card: interrupt a running job or dequeue a pending one (POST /api/sparks/:id/comfy/cancel) |
| Open ComfyUI | One-click link to http://{lanIp}:{comfyPort} (LAN IP preferred so remote browsers do not hit localhost) |
| Model inventory | Checkpoints + LoRAs from /models/* (UI section only when at least one file is listed) |
| Overview chip | When monitoring is on: Comfy · idle / run / Nq / muted if unreachable |
| Layout | Under Services: primary LLM + Comfy side-by-side when both are enabled; collapsible Resources / Services sections |
Not claimed: true per-job VRAM (Comfy does not expose that cleanly over HTTP). Host GPU/VRAM remains on the GPU panel. Live step progress depends on Comfy broadcasting WS events; stock Comfy often scopes detailed progress to the client that submitted the prompt.
How to enable (per Spark)
- Open the Spark tab → Edit (pencil).
- Enable ComfyUI monitoring.
- Set port if needed (default 8188).
- Save.
The Spark page Services section shows the ComfyUI card. On Overview, a small Comfy chip appears for that unit.
Connectivity Test (in Edit) includes ComfyUI when monitoring is enabled.
ComfyUI side requirements
- ComfyUI must be reachable from the sparkDash server on the probe host:
- Local Spark (
isLocal): sparkDash probes127.0.0.1:{port}(use Dockernetwork_mode: hostif the dashboard runs in a container). - Remote Spark: probe uses the Spark LAN IP (same as LLM probes).
- For Open from another machine’s browser, Comfy should listen on a reachable interface (e.g.
--listen 0.0.0.0), not only loopback, and the Spark’s LAN IP must be set correctly in Edit.
Config fields (persisted on the Spark)
| Field | Default | Description |
|---|---|---|
comfyMonitoring |
false |
Probe ComfyUI and show the card / overview chip |
comfyPort |
8188 |
ComfyUI HTTP port |
Related API
| Method | Path | Purpose |
|---|---|---|
| POST | /api/sparks/:id/comfy/cancel |
Cancel a job ({ "promptId": "<uuid>" }) — interrupt running and/or remove from queue |
Env (optional): COMFY_PORT (default 8188), COMFY_PROBE_TIMEOUT_MS, POLL_INTERVAL_COMFY.
Hermes Agent monitoring
sparkDash can optionally monitor Hermes Agent (nousresearch/hermes-agent) on each unit and run one-click updates for you over SSH.
What is supported
| Capability | Details |
|---|---|
| Opt-in per Spark | hermesMonitoring (default off) in Edit Spark |
| Auto update check | Background hermes update --check over SSH (default every 10 min) — returns update availability + pending commits |
| Status badges | In the Spark header: Hermes (installed version), Hermes not found if the binary is missing |
| One-click update | Update Hermes button opens a dialog with live status, real pending commits, and release notes; Update now runs hermes update via SSH (non-interactive go) |
| Update state | Running / success / error surfaced live (button turns into a “Hermes updating… / failed” state) |
| Batch update | Update Hermes on Overview runs hermes update on every monitored unit, with a live per-unit progress bar |
How to enable (per Spark)
- Open the Spark tab → Edit (pencil).
- Enable Hermes Agent.
- Save — background checks start immediately.
The Update Hermes button appears in the Spark header/mobile action row; it turns warning-yellow with a commit-count badge only when an update is actually available. It also appears on Overview (batch) when at least one unit has Hermes enabled.
Connectivity check note: local units run the check as the host user (via setpriv/nsenter, never as container root); remote units run it over SSH. Either way, the logged-in user needs permission to read the Hermes repo.
Side requirements
- Hermes Agent must be installed on the target machine — sparkDash only checks & updates; it does not install it. The binary is looked up in
~/.local/binand/usr/local/bin. - SSH user must be able to run
hermes update --check/hermes updatenon-interactively (key auth recommended). - An update can take a few minutes (repo pull + dependency reinstall); a stale
*.lockfile from a crashed run is cleared before each attempt.
Config fields (persisted on the Spark)
| Field | Default | Description |
|---|---|---|
hermesMonitoring |
false |
Check/update Hermes Agent on this machine |
Related API
| Method | Path | Purpose |
|---|---|---|
| POST | /api/sparks/hermes/update-all |
Batch hermes update on every monitored Spark (Overview button) |
| POST | /api/sparks/:id/hermes/check |
Force hermes update --check now |
| POST | /api/sparks/:id/hermes/update |
Run hermes update in the background (202) |
| GET | /api/sparks/:id/hermes/updates |
Update preview: latest release + installed version + real pending commits + resolved view |
Env (optional): POLL_INTERVAL_HERMES (default 600000 ms), HERMES_UPDATE_TIMEOUT_MS (default 600000 ms).
Quick start
git clone https://github.com/MiaAI-Lab/sparkDash.git
cd sparkDash

# Production (Docker)
docker compose up --build -d

# Or development (host, with hot reload)
npm install
npm run dev
- Docker: open http://<host-ip>:5555 (arm64 image, auto-restart, host mounts for GPU/metrics access)
- Dev: Vite on http://localhost:5173 (proxies API/WS to Express)
For development with Docker (source-mounted, HMR):
docker compose -f docker-compose.dev.yml up --build
Architecture
Design principle: one Spark model, N instances. Every unit is a record in config/sparks.json with a kind field (spark or host). The same SparkMonitor, SystemCollector, and LlmProbe code runs for all of them. Adding a unit is a config change, not a code change.
┌────────────────────── Docker container (sparkDash) ──────────────────────┐
│  Express (server/)                                                         │
│  ├─ config/sparks.json        Spark registry (API read/write)              │
│  ├─ SparkRegistry             load/persist Sparks; change events           │
│  ├─ SparkMonitor (per Spark)  collector + LLM probe + rate baselines       │
│  │   ├─ SystemCollector       local sysfs/proc OR remote SSH               │
│  │   └─ LlmProbe              HTTP to host:LLM_PORT, backend autodetect    │
│  ├─ REST /api/*                                                            │
│  └─ WebSocket /ws             snapshot stream to browsers                  │
│  React SPA (src/)  — Overview + per-Spark pages, themes, dialogs           │
└────────────────────────────────────────────────────────────────────────────┘
         │ SSH (key or sshpass)                    │ HTTP :8888
         ▼                                         ▼
    remote Spark(s)                         each Spark’s LLM server
Data flow
Browser  ←→  WebSocket /ws   ←→  SparkMonitor.snapshot()  ←→  collectors
Browser  ←→  REST /api/*     ←→  SparkRegistry + SparkMonitor
Poll loops run in the background (even with no clients) so rate metrics — tokens/s, network bytes/s, disk I/O — stay correct.
Tech stack
| Layer | Stack |
|---|---|
| Frontend | React 19, TypeScript, Vite 8, Tailwind CSS v4 |
| Backend | Node.js (ESM), Express 5, ws |
| Platform | ARM64 — DGX Spark GB10 (Neoverse V2) |
| Deploy | Docker multi-stage (arm64), Compose |
| Secrets | AES-256-GCM SSH password store |
| Ports | 5555 dashboard/API; 5173 Vite (dev only) |
Repository layout
sparkDash/
├── src/                 React + TypeScript SPA
│   ├── api/             REST client + shared types
│   ├── components/      Overview, Spark pages, dialogs, UI primitives
│   ├── hooks/           WebSocket snapshot, routing
│   └── theme / CSS      Tailwind v4 + four themes
├── server/              Express + WebSocket (plain JS ESM)
│   ├── sparks/          SparkRegistry, SparkMonitor
│   ├── collectors/      SystemCollector, LlmProbe, ssh
│   ├── secretsStore.js  Encrypted password persistence
│   └── validate.js      Host/user validation (SSRF-minded)
├── config/              Runtime state (volume; secrets gitignored)
├── assets/              Screenshots
├── Dockerfile           Production multi-stage arm64
├── docker-compose.yml   Production
├── docker-compose.dev.yml
└── deploy.sh            Rebuild / recreate helpers
REST API
| Method | Path | Purpose |
|---|---|---|
| GET | /api/sparks |
List Sparks (passwords redacted) |
| POST | /api/sparks |
Add Spark and start its monitor |
| PATCH | /api/sparks/:id |
Update Spark (hot-swap config) |
| DELETE | /api/sparks/:id |
Remove Spark and drain monitor |
| PUT | /api/sparks/order |
Persist tab order |
| GET | /api/sparks/:id/metrics |
One-shot metrics snapshot |
| POST | /api/sparks/test |
Ephemeral SSH + LLM (+ Comfy if enabled) test (no persist) |
| POST | /api/sparks/:id/test |
Connectivity test (can save password) |
| POST | /api/sparks/:id/comfy/cancel |
Cancel ComfyUI job by promptId |
| PUT | /api/sparks/:id/password |
Save SSH password (works offline) |
| PUT | /api/sparks/:id/disabled-devices |
Hide storage devices (hot) |
| PUT | /api/sparks/:id/disabled-interfaces |
Hide network interfaces (hot) |
| PUT | /api/sparks/:id/llm-ports |
Replace all LLM ports (hot) |
| POST | /api/sparks/:id/llm-ports |
Add an LLM port (hot) |
| DELETE | /api/sparks/:id/llm-ports/:port |
Remove an LLM port (hot) |
| PUT | /api/sparks/:id/llm-port |
LLM port — backward-compat (hot) |
| GET | /api/settings |
Global settings |
| PUT | /api/settings |
Update global settings |
| WS | /ws |
Real-time metrics stream |
There is no authentication on the HTTP/WebSocket API. Run sparkDash only on a trusted network (or behind your own reverse proxy with auth).
Configuration
Global settings (UI or API)
Gear icon in the header, or GET/PUT /api/settings:
| Setting | Default | Description |
|---|---|---|
| Poll interval | 2000 ms | WebSocket broadcast interval (minimum 1000 ms) |
| Default LLM port | 8888 | Default for new Sparks |
| Auto-hide offline | false | Hide offline Sparks on Overview |
| Temperature unit | Celsius | Display GPU temperature in °C or °F |
Environment variables
Copy .env.example to .env if needed:
| Variable | Default | Description |
|---|---|---|
BIND_HOST |
0.0.0.0 |
HTTP and WebSocket listen address |
PORT |
5555 |
HTTP + WebSocket listen port |
LLM_PORT |
8888 |
Default LLM probe port |
COMFY_PORT |
8188 |
Default ComfyUI probe port |
POLL_INTERVAL_GPU |
2000 |
GPU poll (ms) |
POLL_INTERVAL_COMFY |
2000 |
ComfyUI probe poll (ms) |
POLL_INTERVAL_CPU |
2000 |
CPU / RAM poll (ms) |
POLL_INTERVAL_NETWORK |
2000 |
Network poll (ms) |
POLL_INTERVAL_STORAGE |
5000 |
Storage poll (ms) |
POLL_INTERVAL_LLM |
2000 |
LLM probe poll (ms) |
POLL_INTERVAL_BANDWIDTH |
2000 |
Memory bandwidth / dmon poll (ms) |
POLL_INTERVAL_HERMES |
600000 |
Hermes Agent update check poll (ms) |
HERMES_UPDATE_TIMEOUT_MS |
600000 |
Hard timeout for running hermes update over SSH (ms) |
POLL_INTERVAL_LIVENESS |
5000 |
Online/SSH liveness check (ms) |
SPARKDASH_SECRETS_KEY |
(auto) | Passphrase or 64-char hex for secret encryption |
HOST_PROC_PATH |
/host/proc |
Host proc mount inside container |
HOST_SYS_PATH |
/host/sys |
Host sys mount |
HOST_ROOT_PATH |
/host/root |
Host root mount |
When using Docker's default bridge network, keep
BIND_HOST=0.0.0.0.
Withnetwork_mode: host, useBIND_HOST=127.0.0.1to restrict access to the local host or a reverse proxy.
Adding a unit
- Open the + tab.
- Choose Unit type:
- NVIDIA DGX Spark — the default; hardware summary shows DGX Spark specs and the CX7 IP field is available.
- Dedicated GPU host — any Linux machine with an NVIDIA GPU. It is monitored exactly like a Spark (SSH +
nvidia-smi) but is not reported as a DGX Spark: the header shows a detected hardware summary (GPU model, CPU, RAM) instead of fixed GB10 specs, and the page shows separate RAM and VRAM panels (VRAM fromnvidia-smi, RAM from system memory). On the unit page, RAM → Network → Storage stack in the right column with GPU filling the left column. - Set Name, LAN IP (required), optional CX7 IP (Sparks only), SSH user, and auth (key or password). Wake-on-LAN MAC is auto-read from enP7s7 when online (optional override in Edit).
- Test Connection for SSH + LLM reachability.
- Save — a tab appears and metrics start streaming.
Power controls (shutdown / Wake-on-LAN)
- Shutdown (per Spark or Shutdown All on Overview) runs over SSH:
sudo -n /usr/local/bin/spark-shutdown
Install that script on each Spark and allow passwordless sudo for it only. - Wake / Wake All send a UDP magic packet (port 9). The MAC is taken from the enP7s7 interface automatically while the Spark is online (persisted as
detectedMacAddress). Optionally set a MAC override in Edit Spark. Broadcast is derived as/24from LAN IP, or255.255.255.255if LAN IP is missing. - Batch shutdown only targets online Sparks; offline nodes are skipped.
- Same trust model as the rest of the API: do not expose port 5555 beyond a trusted network — power actions are not separately authenticated.
Themes
Header theme control cycles:
| Theme | Notes |
|---|---|
| Dark (default) | Neutral grays, true black base, muted amber accent |
| Light | Warm paper whites |
| White | Cool neutral whites |
| OLED | True black for OLED panels |
Choice is stored in localStorage.
Security
- SSH passwords are not stored in
sparks.jsonand are never returned by the API. - Passwords are encrypted with AES-256-GCM in
config/sparks-secrets.json(survives restarts). - Encryption key:
config/.secrets-key(auto-generated) orSPARKDASH_SECRETS_KEY. Do not delete the key file or encrypted secrets become unreadable. - Target validation rejects clearly unsafe IPv4 targets (link-local
169.254.0.0/16,0.0.0.0/8, multicast/reserved ≥ 224). Private, loopback, and public addresses are allowed so LAN and remote Sparks work. - SSH and HTTP probes use short timeouts (about 5 s SSH connect, 3 s HTTP) so a hung host cannot stall the poll loop.
- Prefer SSH keys over passwords.
- Treat the dashboard as LAN-trusted: the API is intentionally unauthenticated for ease of use on a private network. That includes power APIs (shutdown / Wake-on-LAN): anyone who can reach the dashboard can request fleet power actions.
Scripts
| Command | Purpose |
|---|---|
npm run dev |
Vite (5173) + Express (5555) together |
npm run dev:server |
Express only (node --watch) |
npm run dev:client |
Vite only |
npm run build |
Production frontend → dist/ |
npm run typecheck |
tsc --noEmit |
npm start |
Production server (node server/index.js) |
npm run docker:up |
docker compose up -d |
npm run docker:prod |
Same as docker:up |
npm run docker:rebuild |
docker compose up --build -d |
npm run docker:dev |
Dev Compose |
npm run docker:dev:build |
Dev Compose with rebuild |
./deploy.sh |
Recreate container; --build, --frontend flags |
How it works
Local vs remote Sparks
One SystemCollector path for both modes. When spark.isLocal is true, metrics come from host sysfs/proc and nvidia-smi (often via nsenter into the host namespace). Remote Sparks wrap the same commands in a shared sshExec() helper (key agent or sshpass). For kind: "host" units, actual hardware (GPU model, driver version, CPU, RAM) is detected once and cached in place of the static DGX Spark specs, and GPU VRAM comes straight from nvidia-smi while system RAM is read from /proc/meminfo.
Graceful degradation
Collectors catch errors and return zero/default metrics instead of crashing the loop. After sustained liveness failures, a Spark is marked offline; the UI shows stale or empty states rather than hard errors.
Hot configuration
Name, IP, SSH credentials, LLM port, and device/interface filters update the running SparkMonitor without tearing down poll loops or losing rate baselines. Registry writes are atomic (temp file + rename).
LLM probe
Each configured LLM port gets its own LlmProbe instance running in parallel. Probes auto-detect backends:
- llama.cpp —
/slotsfor live decode rates; model from/props - ds4-server (Entrpi/ds4-on-spark) —
/v1/models(owned_by: ds4.c) + Prometheusds4_*token counters for live tok/s - vLLM / sglang —
/v1/models; sglang via/get_server_info(last_gen_throughputwhen metrics off), vLLM via Prometheus/metricscounters (scientific notation supported)
Rates are derived from per-probe cumulative counter diffs (or SGLang sticky throughput while it moves). Multiple ports can be added or removed at runtime without restarting the monitor.
Contributing
Contributions are welcome. Conventions:
- Server: plain JavaScript ESM
- Client: TypeScript + React
- Prefer extending the shared Spark model over per-unit special cases
License
MIT — Copyright (c) 2026 Mia'a AI Lab
Acknowledgements
- Built for the NVIDIA DGX Spark (GB10) on ARM64
- Rebuilt from a legacy multi-unit dashboard with a single shared Spark model (no copy-pasted “Spark N” code paths)
- LLM probe behavior refined from production monitoring experience