
Anubis 





Local LLM Testing & Benchmarking for Apple Silicon | Community Leaderboard
brew install --cask uncsoft/anubis/anubis-oss
Or download the zip directly from the Releases page and drag to /Applications.
🚨 Benchmark analysis is live! Check out the results here, over 400+ community submitted runs analyzed Benchmark Report
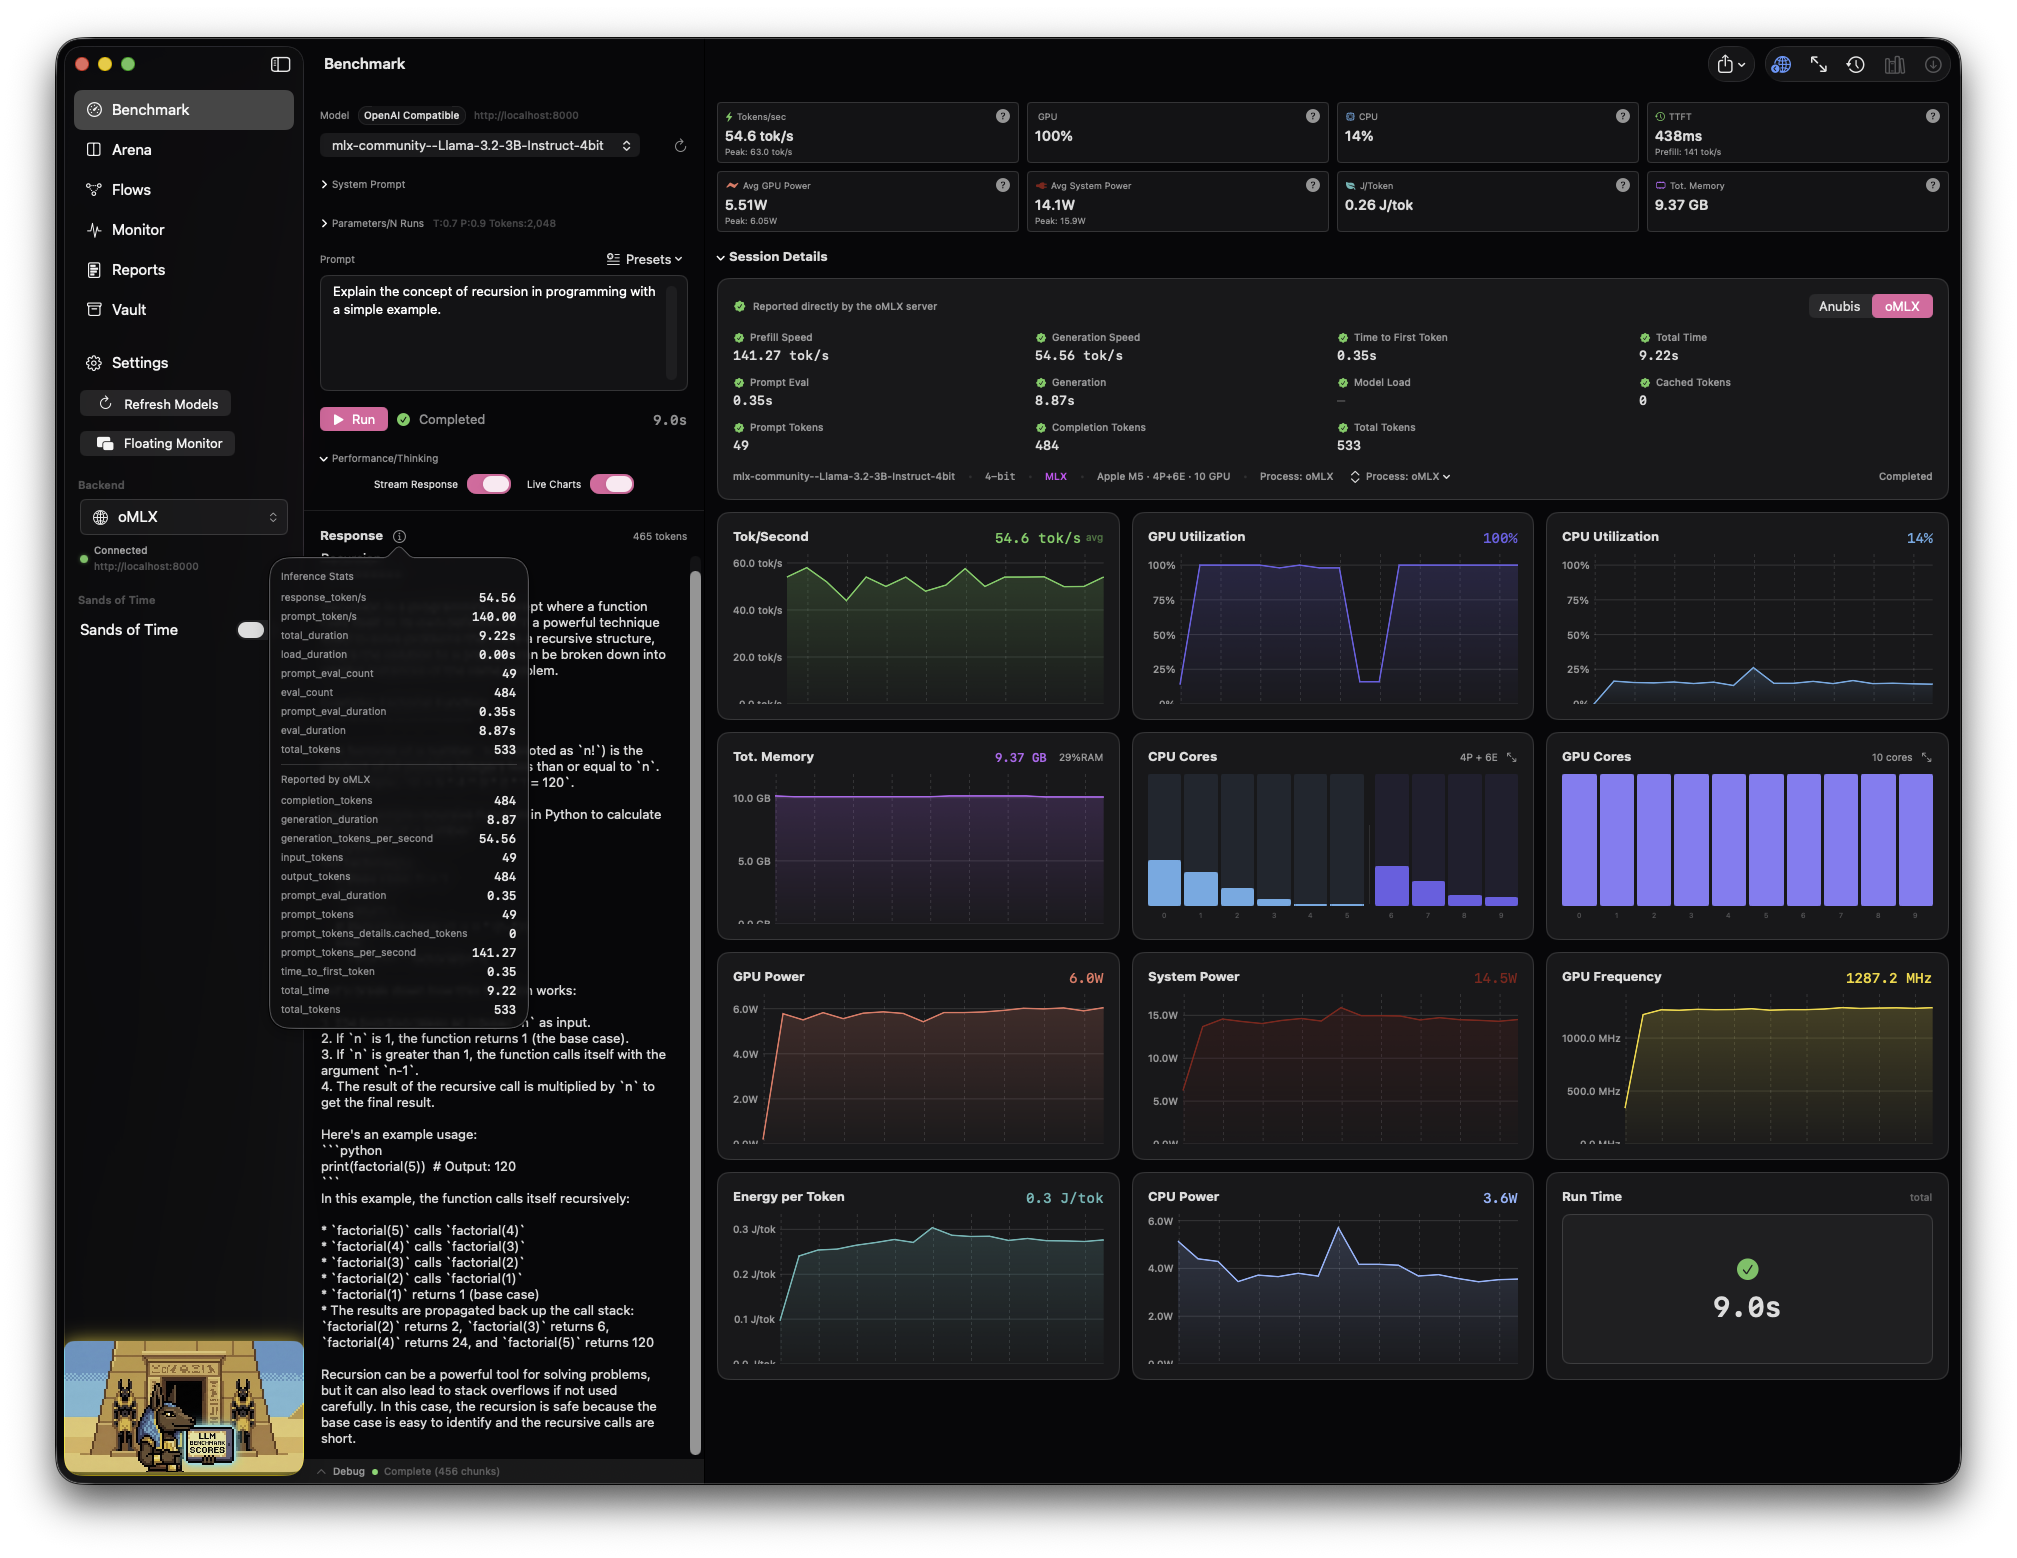
Anubis is a native macOS app for benchmarking, comparing, and managing local large language models using any OpenAI-compatible endpoint - Ollama, MLX, oMLX, LM Studio Server, OpenWebUI, Docker Models, etc. Built with SwiftUI for Apple Silicon, it provides real-time hardware telemetry correlated with full, history-saved inference performance - something no CLI tool or chat wrapper offers. Export benchmarks directly without having to screenshot, and export the raw data as .MD or .CSV from the history. You can even OLLAMA PULL models directly within the app.
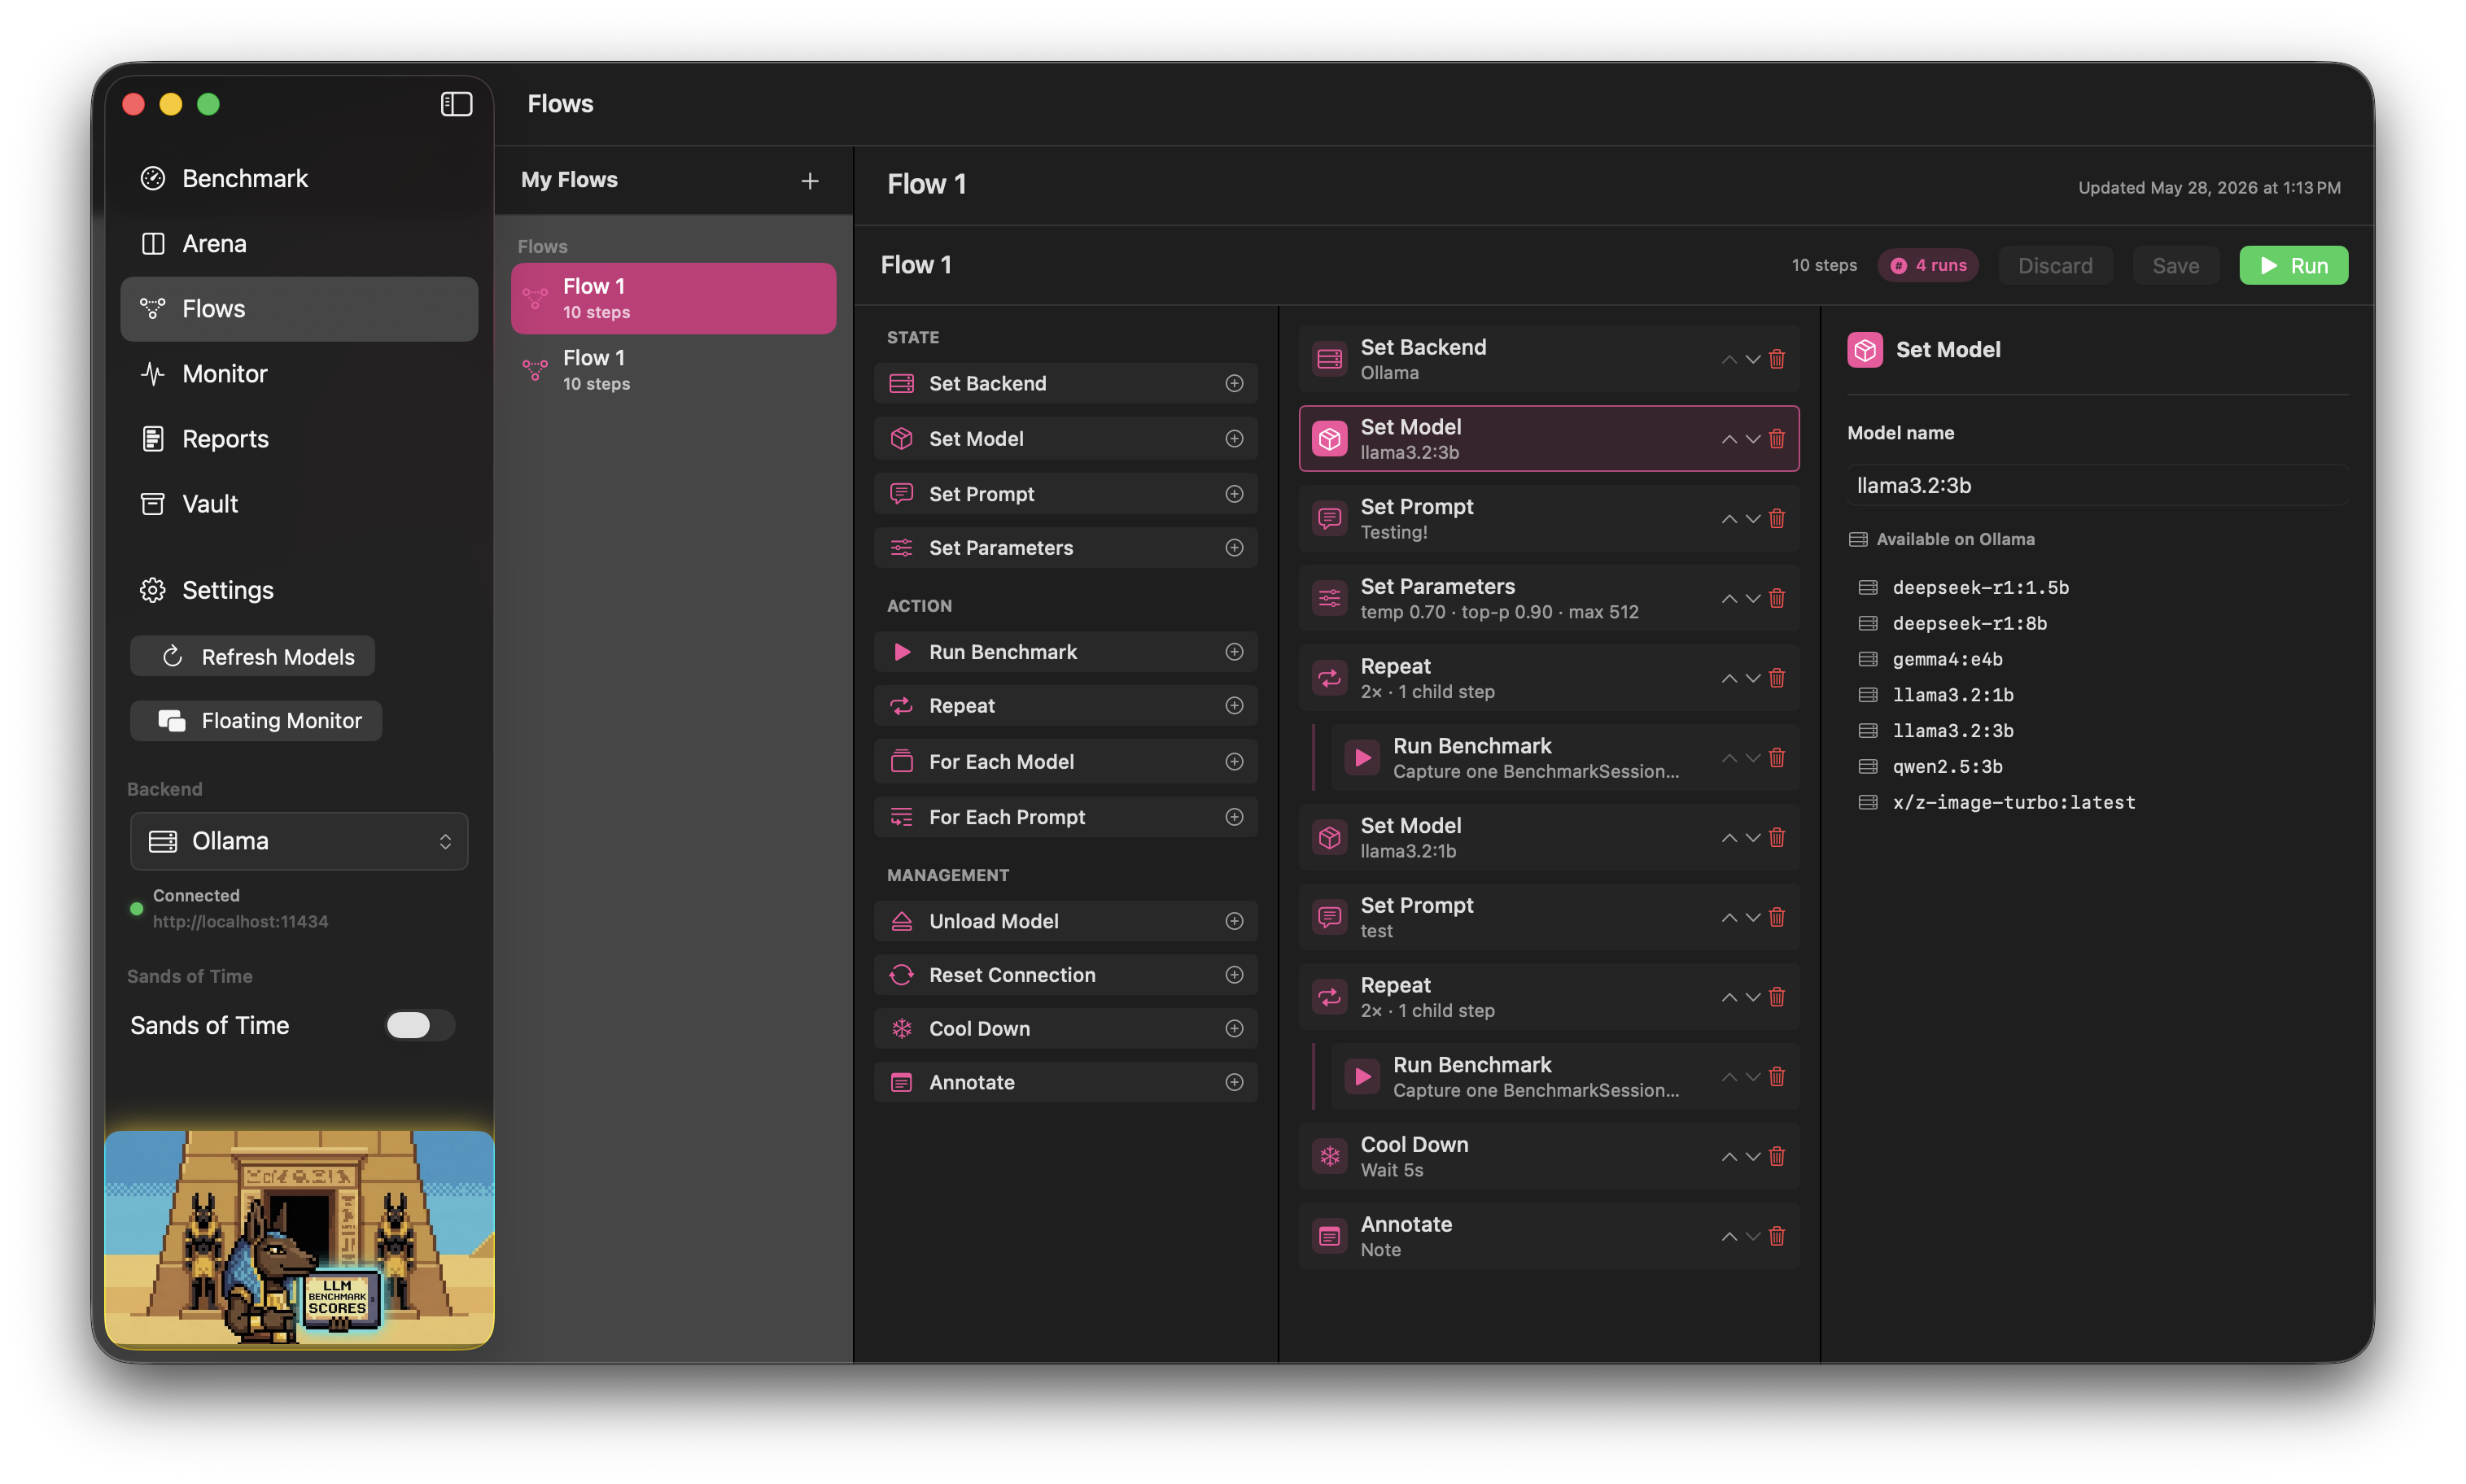
New in 3.7: the Flow Builder — drag-and-drop sequencer for multi-model / multi-prompt / N-rep benchmark runs, with share-ready 16:9 or 1:1 report cards. Build it once, run it hands-off, post the PNG.
What's New
Flow Builder — Drag-and-Drop Benchmark Sequencer (New in 3.7)
Build, save, and share repeatable benchmark recipes — a Shortcuts-style editor where you sequence steps like Set Backend → Set Model → Repeat × 5 → Run Benchmark → Unload and play them back hands-off. Every individual run still lands in normal Run History, and the whole sequence gets a single share-ready report.
Why use a flow instead of clicking Run repeatedly?
- Sweep multiple models or quantizations in one go (For Each Model, For Each Prompt)
- Repeat the same config N times for honest mean ± 95% CI numbers
- Wire up cold-vs-warm comparisons with explicit Unload Model + Cool Down steps
- Step away — long sweeps complete unattended and produce one report
- Save flows as .anubisflow JSON to share, version, or move between machines
Editor. Three panes: a left Palette of step blocks, a center Step List rendered as a nestable tree, a right Inspector that swaps controls per step type. Add steps by clicking a palette block or dragging it into precise position. Reorder by drag, by ↑/↓ chevrons, or by editing the tree directly. Containers (Repeat, For Each Model, For Each Prompt) hold child steps with an indented rail.
Live lint. As you build, Anubis flags dangling Set steps (e.g. a Set Model with no following Run Benchmark), empty For Each lists, blank entries, and Run Benchmarks that are missing required prior Sets. The header chip jumps straight to the offending step.
For Each, explicitly. Two rules worth remembering:
- For Each replaces the corresponding Set. Inside a
For Each Model, the active model is whatever the iterator just picked — any priorSet Modelis ignored for that iteration (the lint catches this). - Nested containers multiply. Total runs = outer × inner × deeper.
3 models × 2 prompts × 5 reps = 30 BenchmarkSessions.
Templates. Sidebar + → New from Template ships six starters: Quick Smoke Test, Repeated Run (5×), Cold vs Warm Start, Multi-Model Comparison, Q4 vs Q8 Quantization, Prompt Variants. Each is a real working flow; edit or use as-is.
Run sheet. Live progress with checkmarks per step, a scrollback log, a "Run X of Y" counter, and a per-run latest-session preview. Stop (⌘.) cancels cleanly mid-run.
Reports built for sharing. Post-run, View Report (⇧⌘R) opens a forced-dark, 1920×1080 card with a hero, winner callout, per-model leaderboard with relative bars, per-rep tables, and a methodology footer. Toggle to a 1080×1080 square for Instagram/X. Save as PNG @ 2× retina (3840×2160 or 2160×2160), copy to clipboard, or save the per-model CSV. Past runs live in the sidebar's Run History section.
Import / export. Right-click any flow → Export… writes a portable .anubisflow JSON file. + → Import .anubisflow… reads it back. Format versioned so older clients refuse newer files instead of silently misreading them.
Open the in-app Help sheet (the ? in the Flows sidebar header) for the full reference, including worked code-style examples of each For Each pattern.
Run History Management + Browse Ollama Models (New in 3.6)
The History window is now genuinely usable, and discovering Ollama models no longer requires leaving the app.
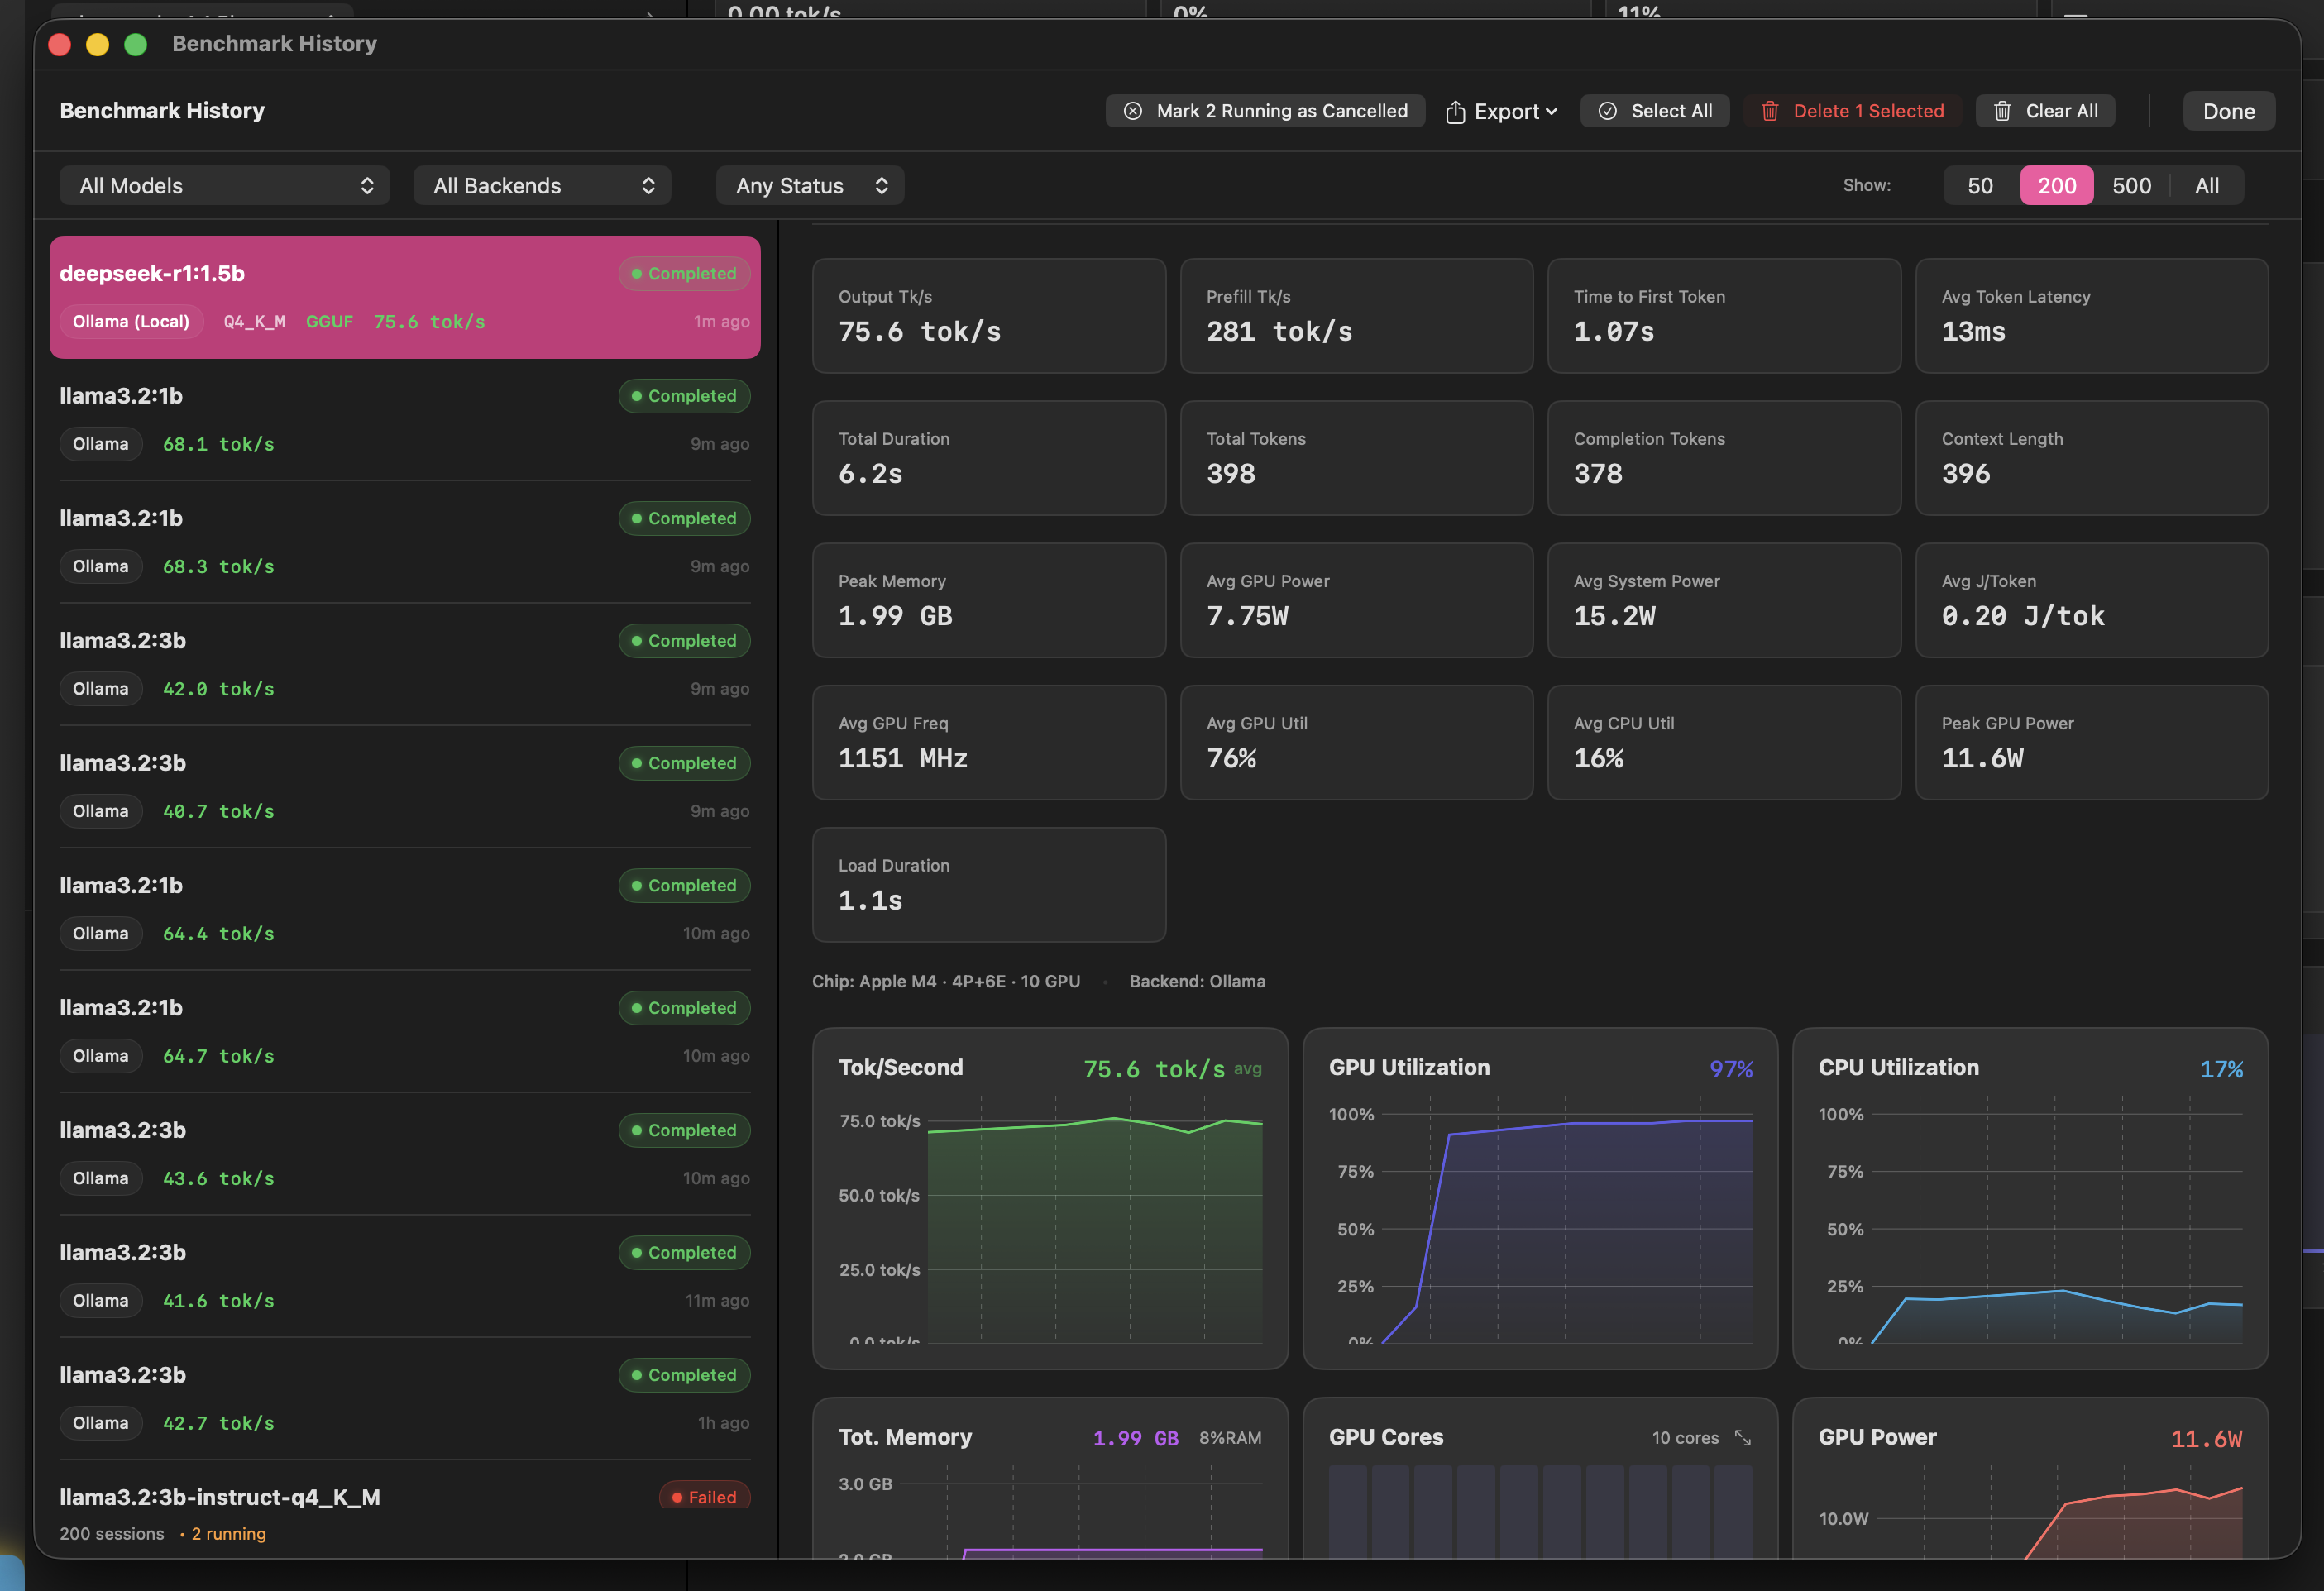
- History — filter bar (Model / Backend / Status) plus a Show: 50 / 200 / 500 / All picker (the 20-row ceiling is gone). Multi-select via ⌘-click and ⇧-click. New Select All Filtered + Delete N Selected buttons let you prune subsets — e.g. filter to Status = Cancelled → Select All → Delete — without nuking everything. Fixes #26.
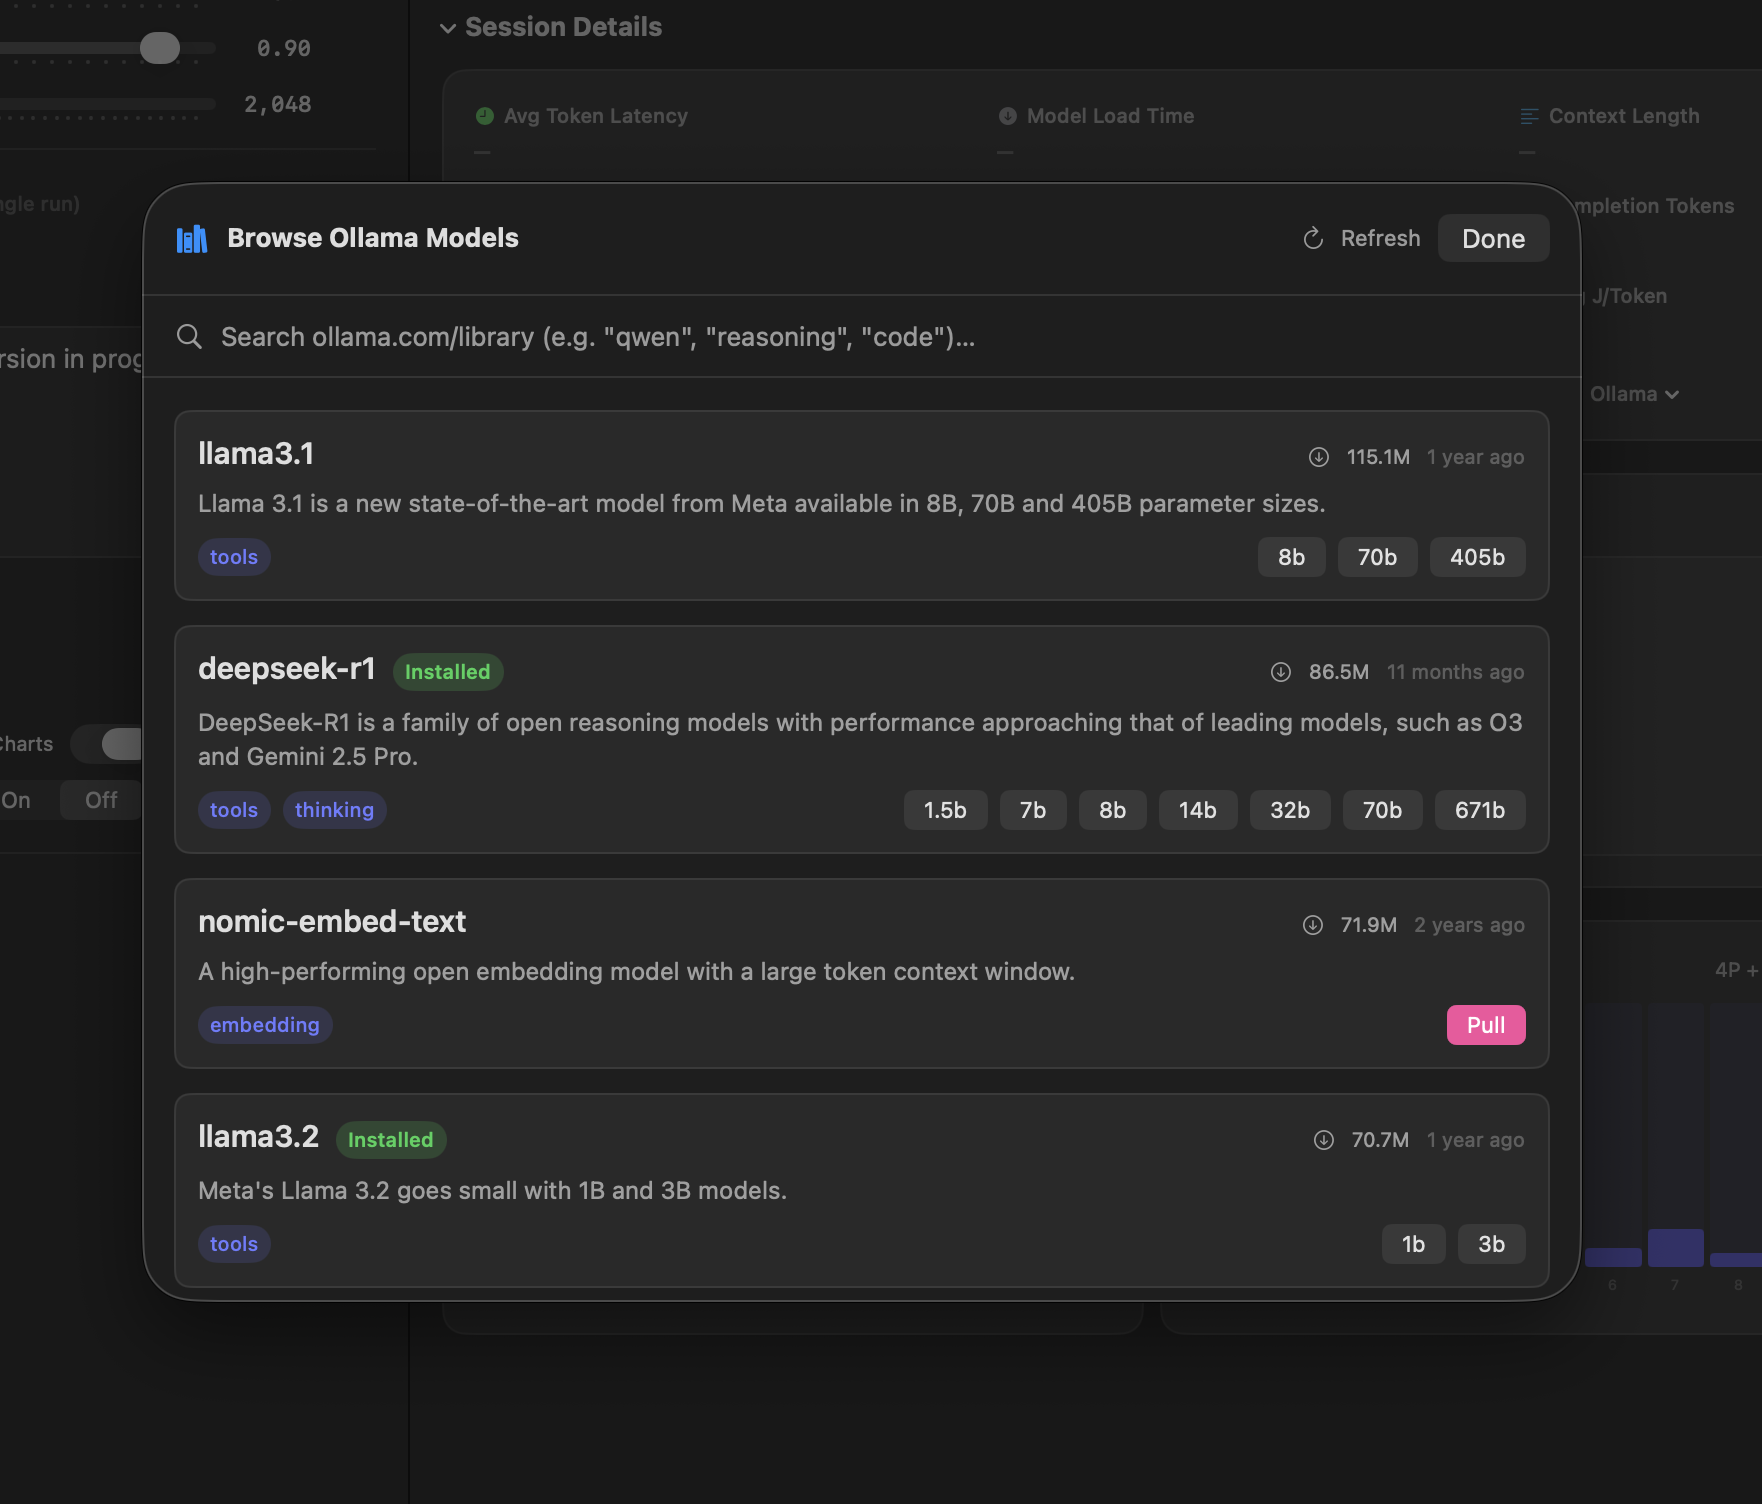
- Browse Ollama models — new toolbar button (Ollama backend only) opens a sheet that fetches
https://ollama.com/librarydirectly. Cards show description, capability chips, size buttons, pull count, last-updated; click a size to pull through the existing progress UI. Search hits/search?q=…. Already-installed models show a green badge. 24-hour client-side cache, Refresh button to bypass it. - Cancel actually cancels — clicking Cancel during a pull now stops the download (it used to dismiss the sheet but leave the HTTP read running in the background). Partial blobs stay on disk so re-pulls resume.
- Leaderboard upload is prominent + optional auto-submit — toolbar upload button is now a state machine (idle / Submit / Submitting / Submitted ✓ / Retry). Settings → Community Leaderboard has a display-name field plus a default-off "Auto-submit completed runs" toggle that uploads every successful run (and every rep of a group) silently in the background.
- Polish — Parameters and Performance/Thinking sections default to expanded so first-time users see the N-runs stepper and Ollama Thinking picker without discovering the chevrons (preference persists once changed). New (i) button next to Thinking opens a popover that explains all three modes, why only Ollama exposes the
thinkfield, and what to do when a model rejects it.
N-Rep Benchmark Groups + Accurate SoC Power (New in 3.5)
Bundle N consecutive runs of the same configuration into one benchmark with mean and 95% bootstrap confidence intervals, plus a significant correction to system-wide power accounting.
- N-Rep groups — Repetitions stepper (1–20) in the benchmark toolbar. On completion the dashboard surfaces mean ± 95% bootstrap CI (1000 resamples) for tok/s, TTFT, J/Tok, system power, GPU power, and peak memory. Seed strategy picker: Random (captures both hardware and sampler variance) or Fixed (hardware-only variance for reproducibility). Per-rep streaming and per-rep charts are preserved.
- Group context on the leaderboard — group reps now submit with
run_group_id, sample count, rep index, seed strategy, and mean ± CI for the headline metrics. The leaderboard page renders "±CI · N reps" inline under tok/s on group rows; the explorer surfaces the group aggregates as sortable columns. - Corrected SoC power accounting — the CPU, ANE, and DRAM power channels reported by IOReport use different units (mJ) than the GPU channel (nJ). The prior implementation treated all four uniformly, so CPU/ANE/DRAM contributions were effectively rounded out of
system_powerand the headlineJ/Tokmetric was a corresponding undercount. Per-channel scaling is now correct; methodology version tag bumps 1 → 2 so cross-version comparisons stay honest. Migration v7 in the local app DB retroactively rescales historical sessions. - LM Studio reliability — fixed the alternating-failure pattern in N>1 groups (the
Connection: closeheader we'd added for Ollama chunk pacing was causing LM Studio to reject the immediately-following request). Auto-detection now correctly identifies the inference worker at~/.lmstudio/.internal/utils/node, with a self-healing soft pin that re-evaluates every 2 s. Stops mis-attributing to Ollama after a model switch. - M5 Max GPU frequency — fixed the pinned-at-1084-MHz bug from an inverted Hz/KHz/MHz scale heuristic.
- Streaming hardening — TextKit 1 retained (TK2 had viewport-layout issues on appended text); stream consume task promoted to
.userInteractivepriority;@Publishedcascades batched at 1 Hz during multi-rep group streaming; font-level ligature disable bypasses theCopyOfFontWithLigatureSettinghot path that caused the 25-rep hang.
Search and Download Ollama Models right from inside the app!
- Find, download, run and benchmark models straight from Ollama's API
Ollama Thinking Toggle (New in 3.2)
Tri-state control over Ollama's think request parameter, exposed in the Benchmark Performance disclosure when the Ollama backend is selected.
- Auto (default) — omit the field so the model uses its server-side default; safe for older Ollama versions and non-thinking models that reject the parameter
- On — force
think:trueto enable reasoning where supported - Off — force
think:falseto disable reasoning on models that default it on (e.g. recent DeepSeek-R1 builds)
The choice persists across launches.
Reasoning-Aware Metrics & Prefill Speed (New in 3.1)
Output tokens/sec is now visible-throughput only for reasoning models. Previously, thinking time was charged against TTFT and thinking tokens were counted as output, inflating the numbers. Fixes #17 and #18.
- Output tok/s excludes thinking time — for DeepSeek-R1, Qwen3-thinking, GLM, gpt-oss, and other reasoning models
- Prefill (input) tokens/sec is a first-class metric — visible on the TTFT card, in session history, in CSV export, and on the leaderboard
- Reasoning split — thinking-model runs record reasoning tokens and reasoning duration separately; the session detail view shows reasoning tok/s alongside output tok/s
- Visible thinking — both Ollama and OpenAI-compatible backends decode reasoning content (
reasoning_content,reasoning, or inline<think>…</think>tags) and surface it wrapped in<think>…</think>markers in the response - Better error messages — Ollama HTTP errors no longer surface as "timed out after 0 seconds"
Apple Intelligence Backend (New in 3.0) 🍎
Anubis now benchmarks Apple's on-device Foundation Model alongside Ollama, MLX, and the rest — no server, no network, no setup. If your Mac supports Apple Intelligence (macOS 26+), it shows up in the backend menu automatically.
- Zero configuration — pick
Apple Intelligencefrom the backend selector and run; it talks directly to the on-device model via Apple'sFoundationModelsframework - Streaming token output like every other backend, with the same live charts and metric cards
- System prompt support maps to Foundation Models
Instructions - Cleanly hidden on macOS versions or hardware without Apple Intelligence
Reports Tab — Export (New in 3.0)
Export the per-model performance summary directly from the Reports tab.
- Markdown — branded report with hardware banner, table, and Fastest / Most-efficient summary
- CSV — flat per-model rows for spreadsheet analysis
- Respects your current selection, or exports all models when none are selected
Denser Benchmark Dashboard (New in 3.0)
- 3-column live chart grid (was 2) — fits more on screen without scrolling
- Collapsible Session Details to reclaim vertical space
- Run Time card fills the trailing grid slot so the layout always reads even
- Cleaner chart axes — wall-clock x-axis labels removed in favor of gridlines
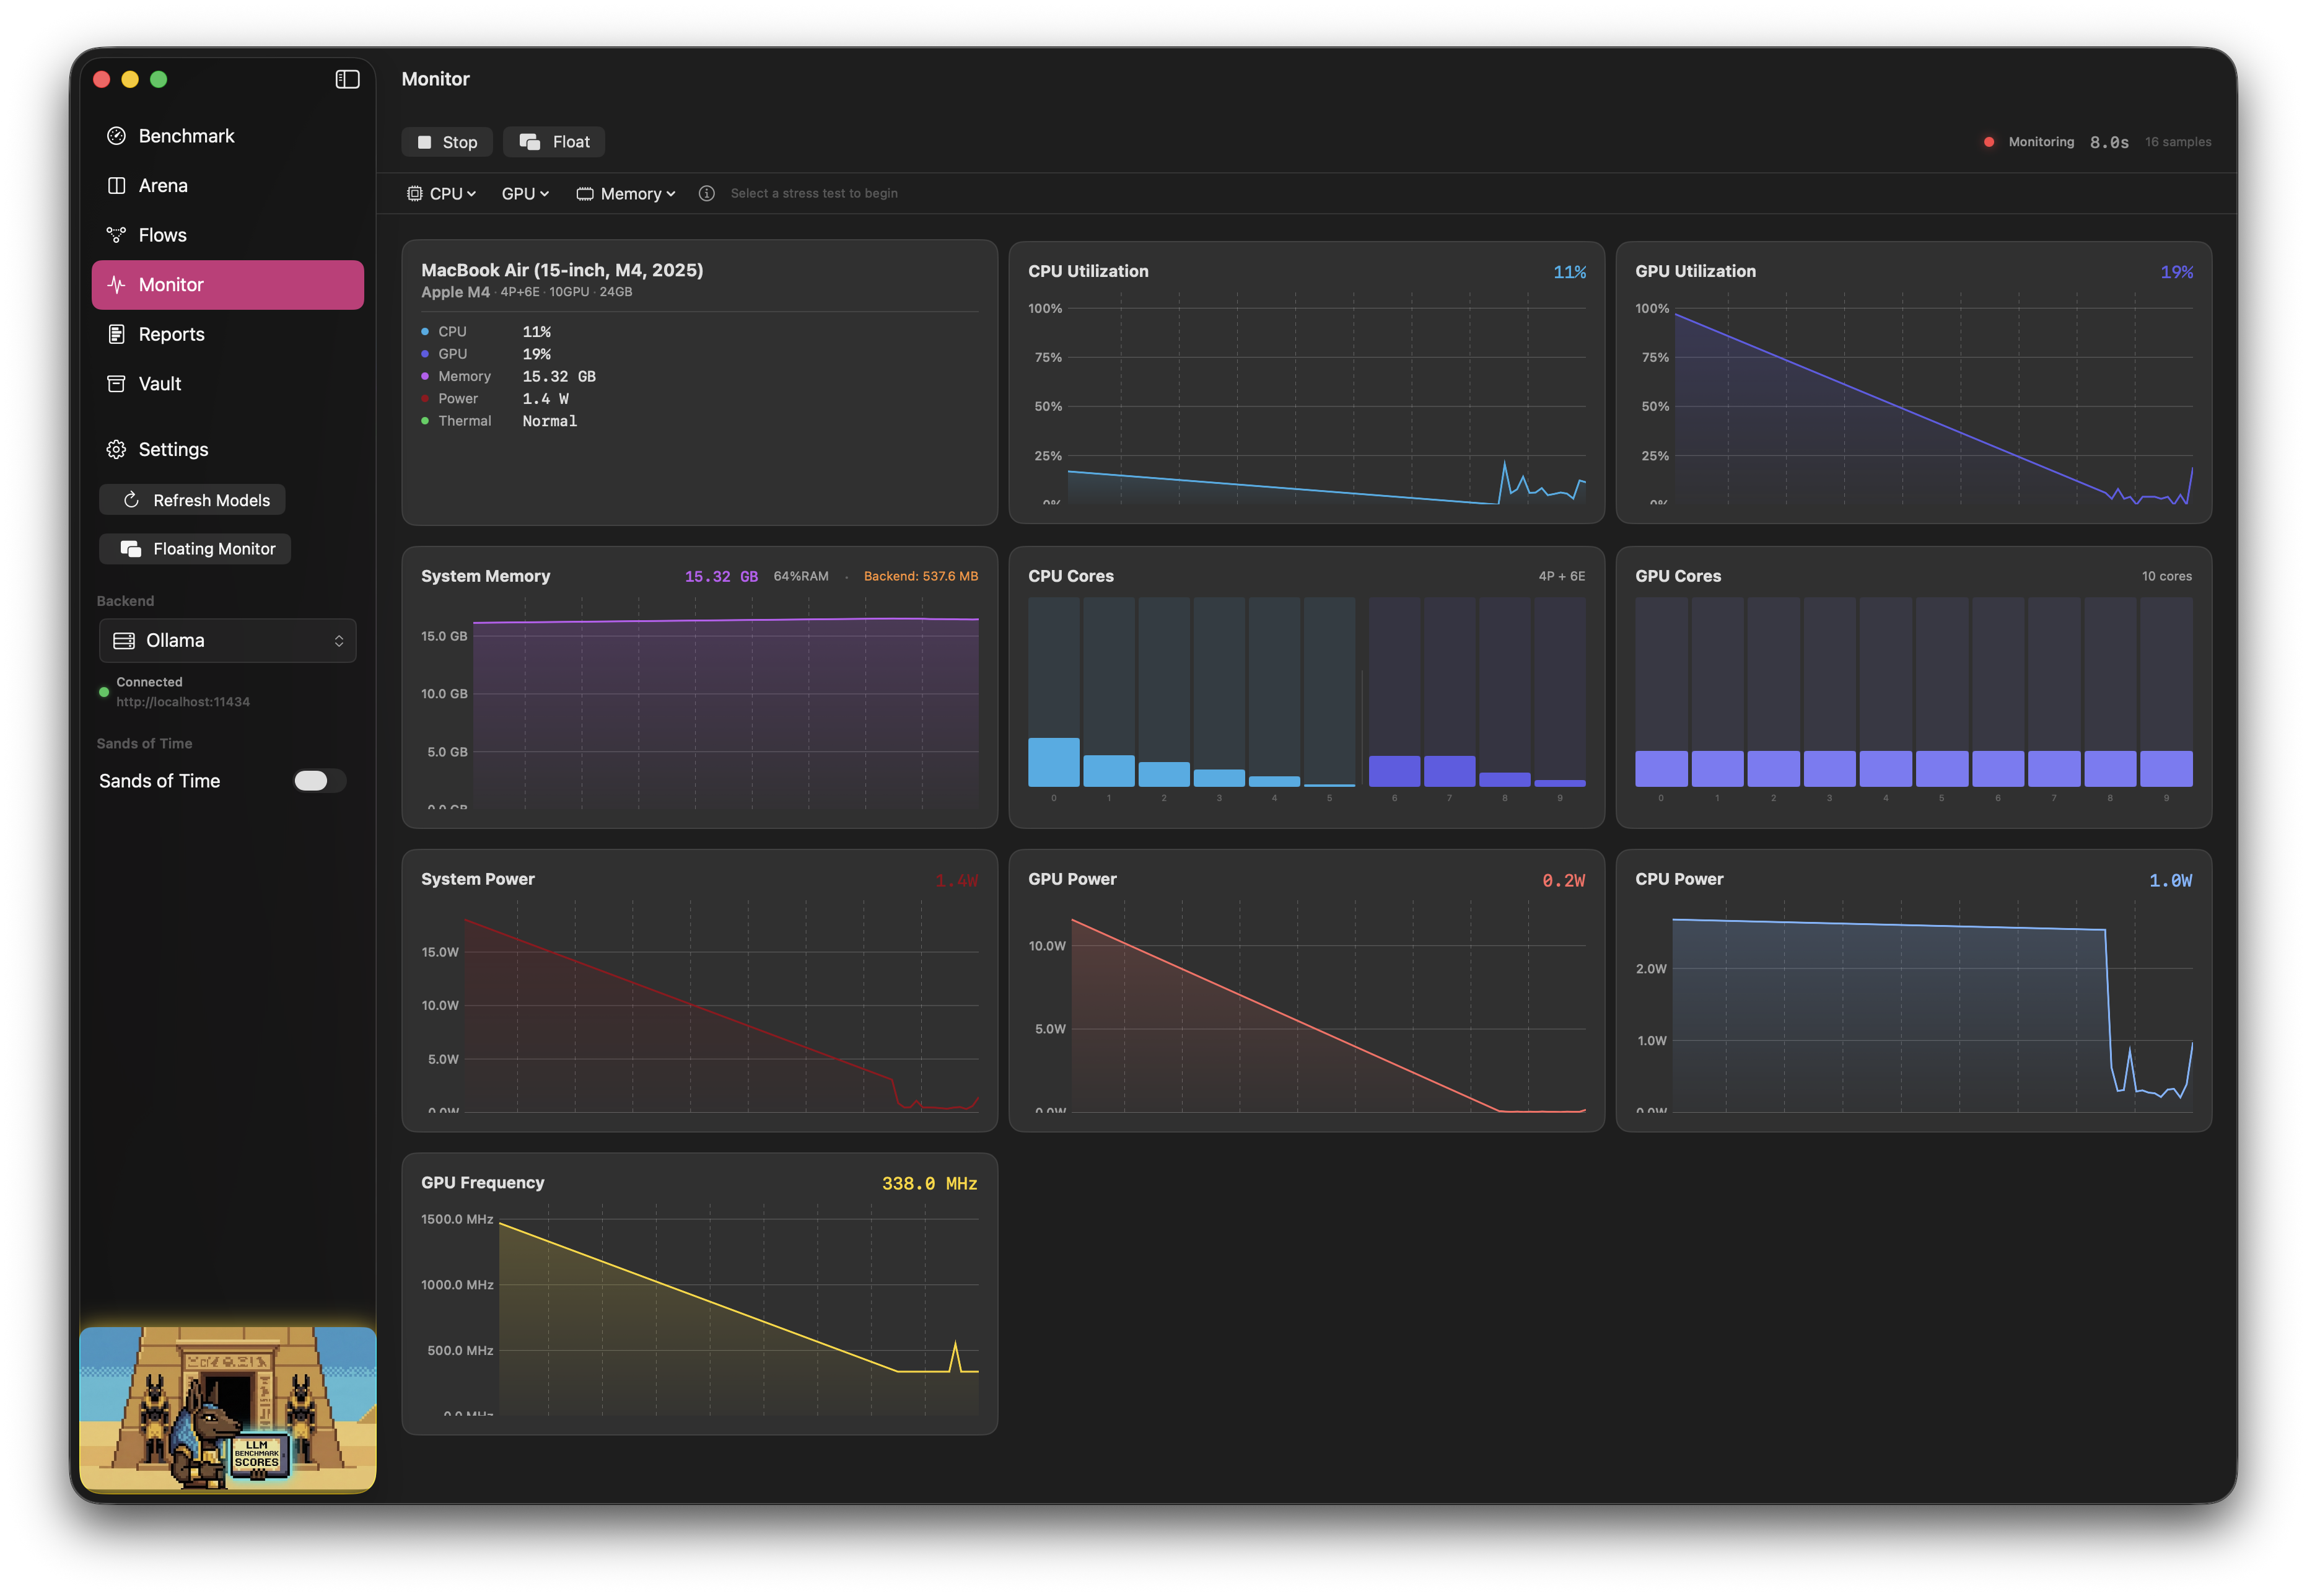
Hardware Stress Testing (New in 2.9)
Push your Apple Silicon to its limits and observe power draw, thermal throttling, and frequency scaling under controlled load - all from within the Monitor.
- CPU stress - spawns
yesprocesses per core. Choose All Cores, P-Cores only, E-Cores only, or Single Core - GPU stress - Metal compute shader renders a Mandelbrot fractal zoom in a separate window. Randomized zoom targets and color palettes on each run. Four intensity levels (Low / Medium / High / Extreme) control iterations, supersampling, and passes per frame
- Memory bandwidth stress - allocates memory then continuously streams through it with
memcpyto saturate the memory bus. Reports measured bandwidth in GB/s, directly comparable to your chip's theoretical max. Three pressure levels (Light 25% / Moderate 50% / Heavy 75% of free memory) - Safety mechanisms - 5-minute auto-timeout, thermal watchdog (auto-stop at critical), GPU auto-downgrade if FPS drops below 5, cleanup on view disappear and app quit
Floating Monitor HUD (New in 2.9)
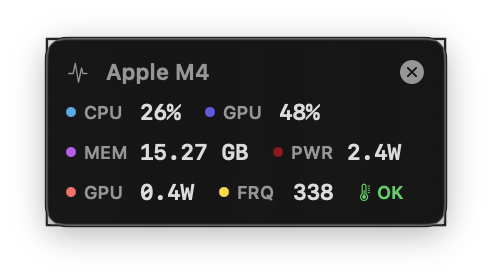
A compact, frameless, always-on-top overlay showing live system metrics - launchable from any tab via the sidebar or from the Monitor's Float button.
- Dark glass material, draggable, visible on all Spaces
- Live CPU %, GPU %, memory, power, GPU frequency, and thermal state
- Hides the main window when launched from Monitor (detach mode) or stays alongside when launched from the sidebar
15 Benchmark Prompts (New in 2.9)
Five new built-in prompts covering causal reasoning, system design, dialogue writing, historical analysis, and constrained writing - bringing the total to 15 across five categories.
Why Anubis?
The local LLM ecosystem on macOS is fragmented:
- Chat wrappers (Ollama, LM Studio, Jan) focus on conversation, not systematic testing
- Performance monitors (asitop, macmon, mactop) are CLI-only and lack LLM context
- Evaluation frameworks (promptfoo) require YAML configs and terminal expertise
- No tool correlates hardware metrics (GPU / CPU / ANE / power / memory) with inference speed in real time
Anubis fills that gap - all in a native macOS app.
Leaderboard Submissions Now Available! Submit directly through the app
The dataset is robust and open source - check it out here, please contribute!
Features
Benchmark
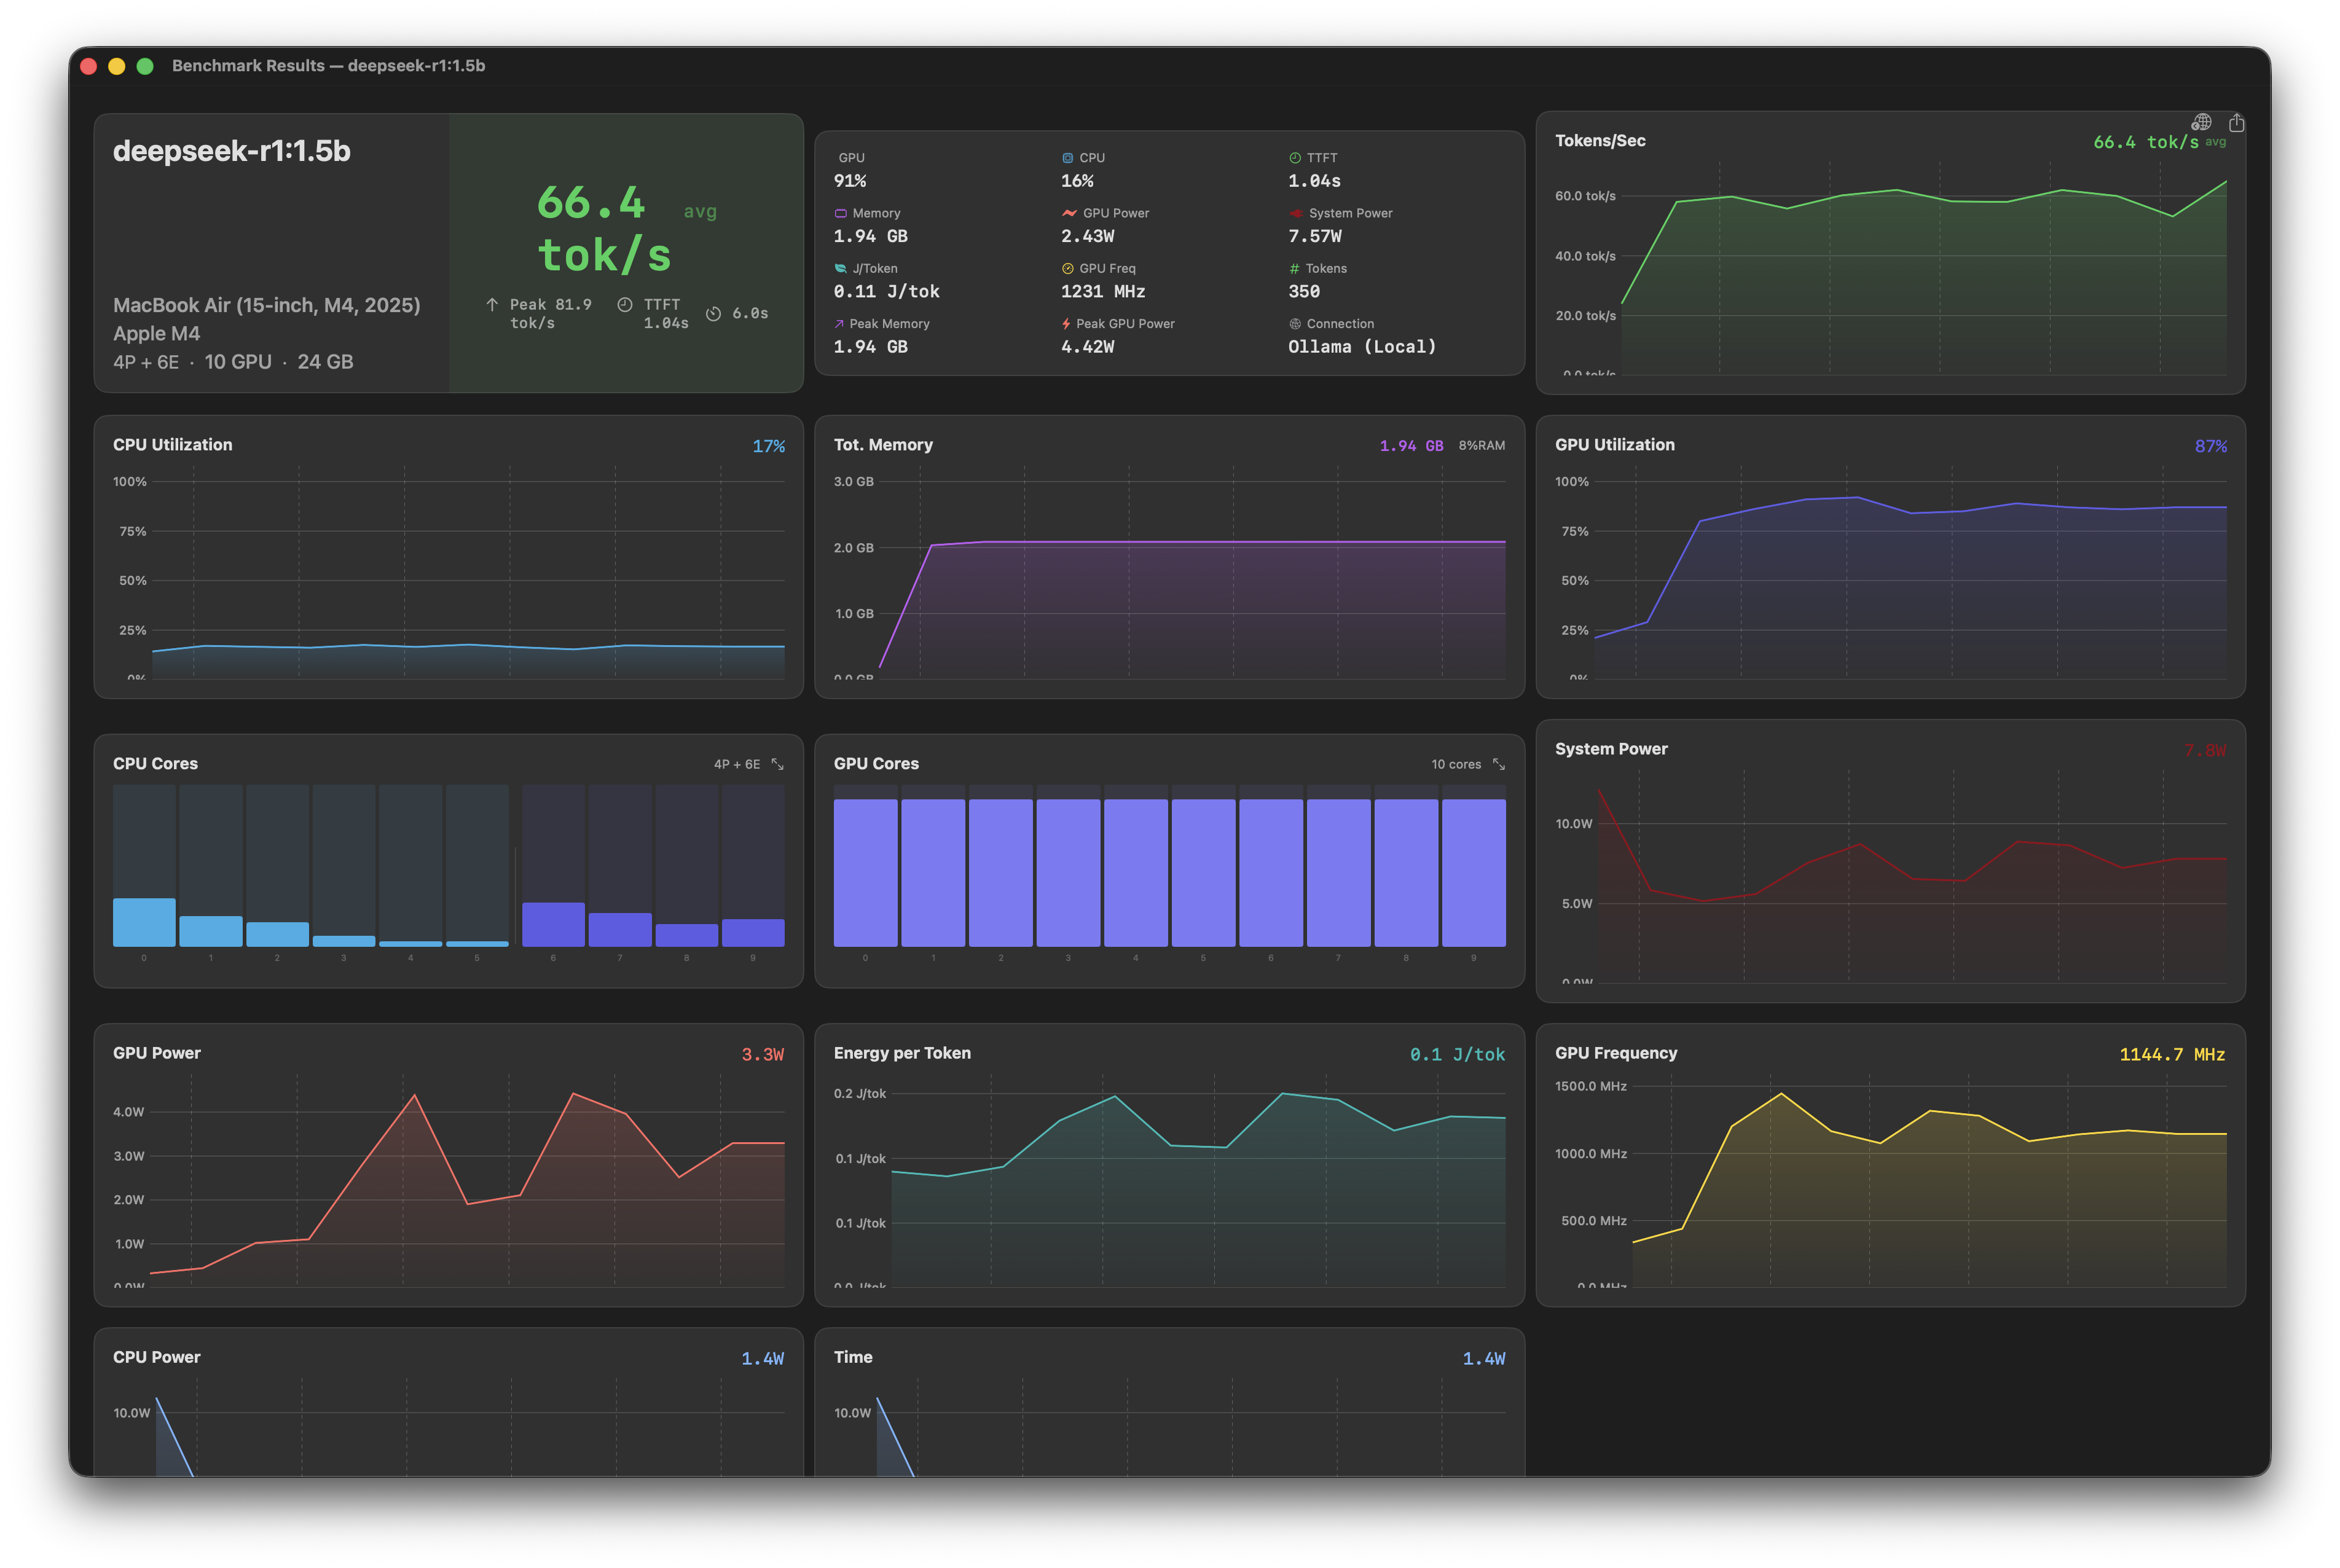
Real-time performance dashboard for single-model testing.
- Select any model from any configured backend
- Stream responses with live metrics overlay
- 8 metric cards: Output Tok/s, GPU %, CPU %, TTFT (with Prefill tok/s subtitle), Process Memory, Model Memory, Thermal State, GPU Frequency
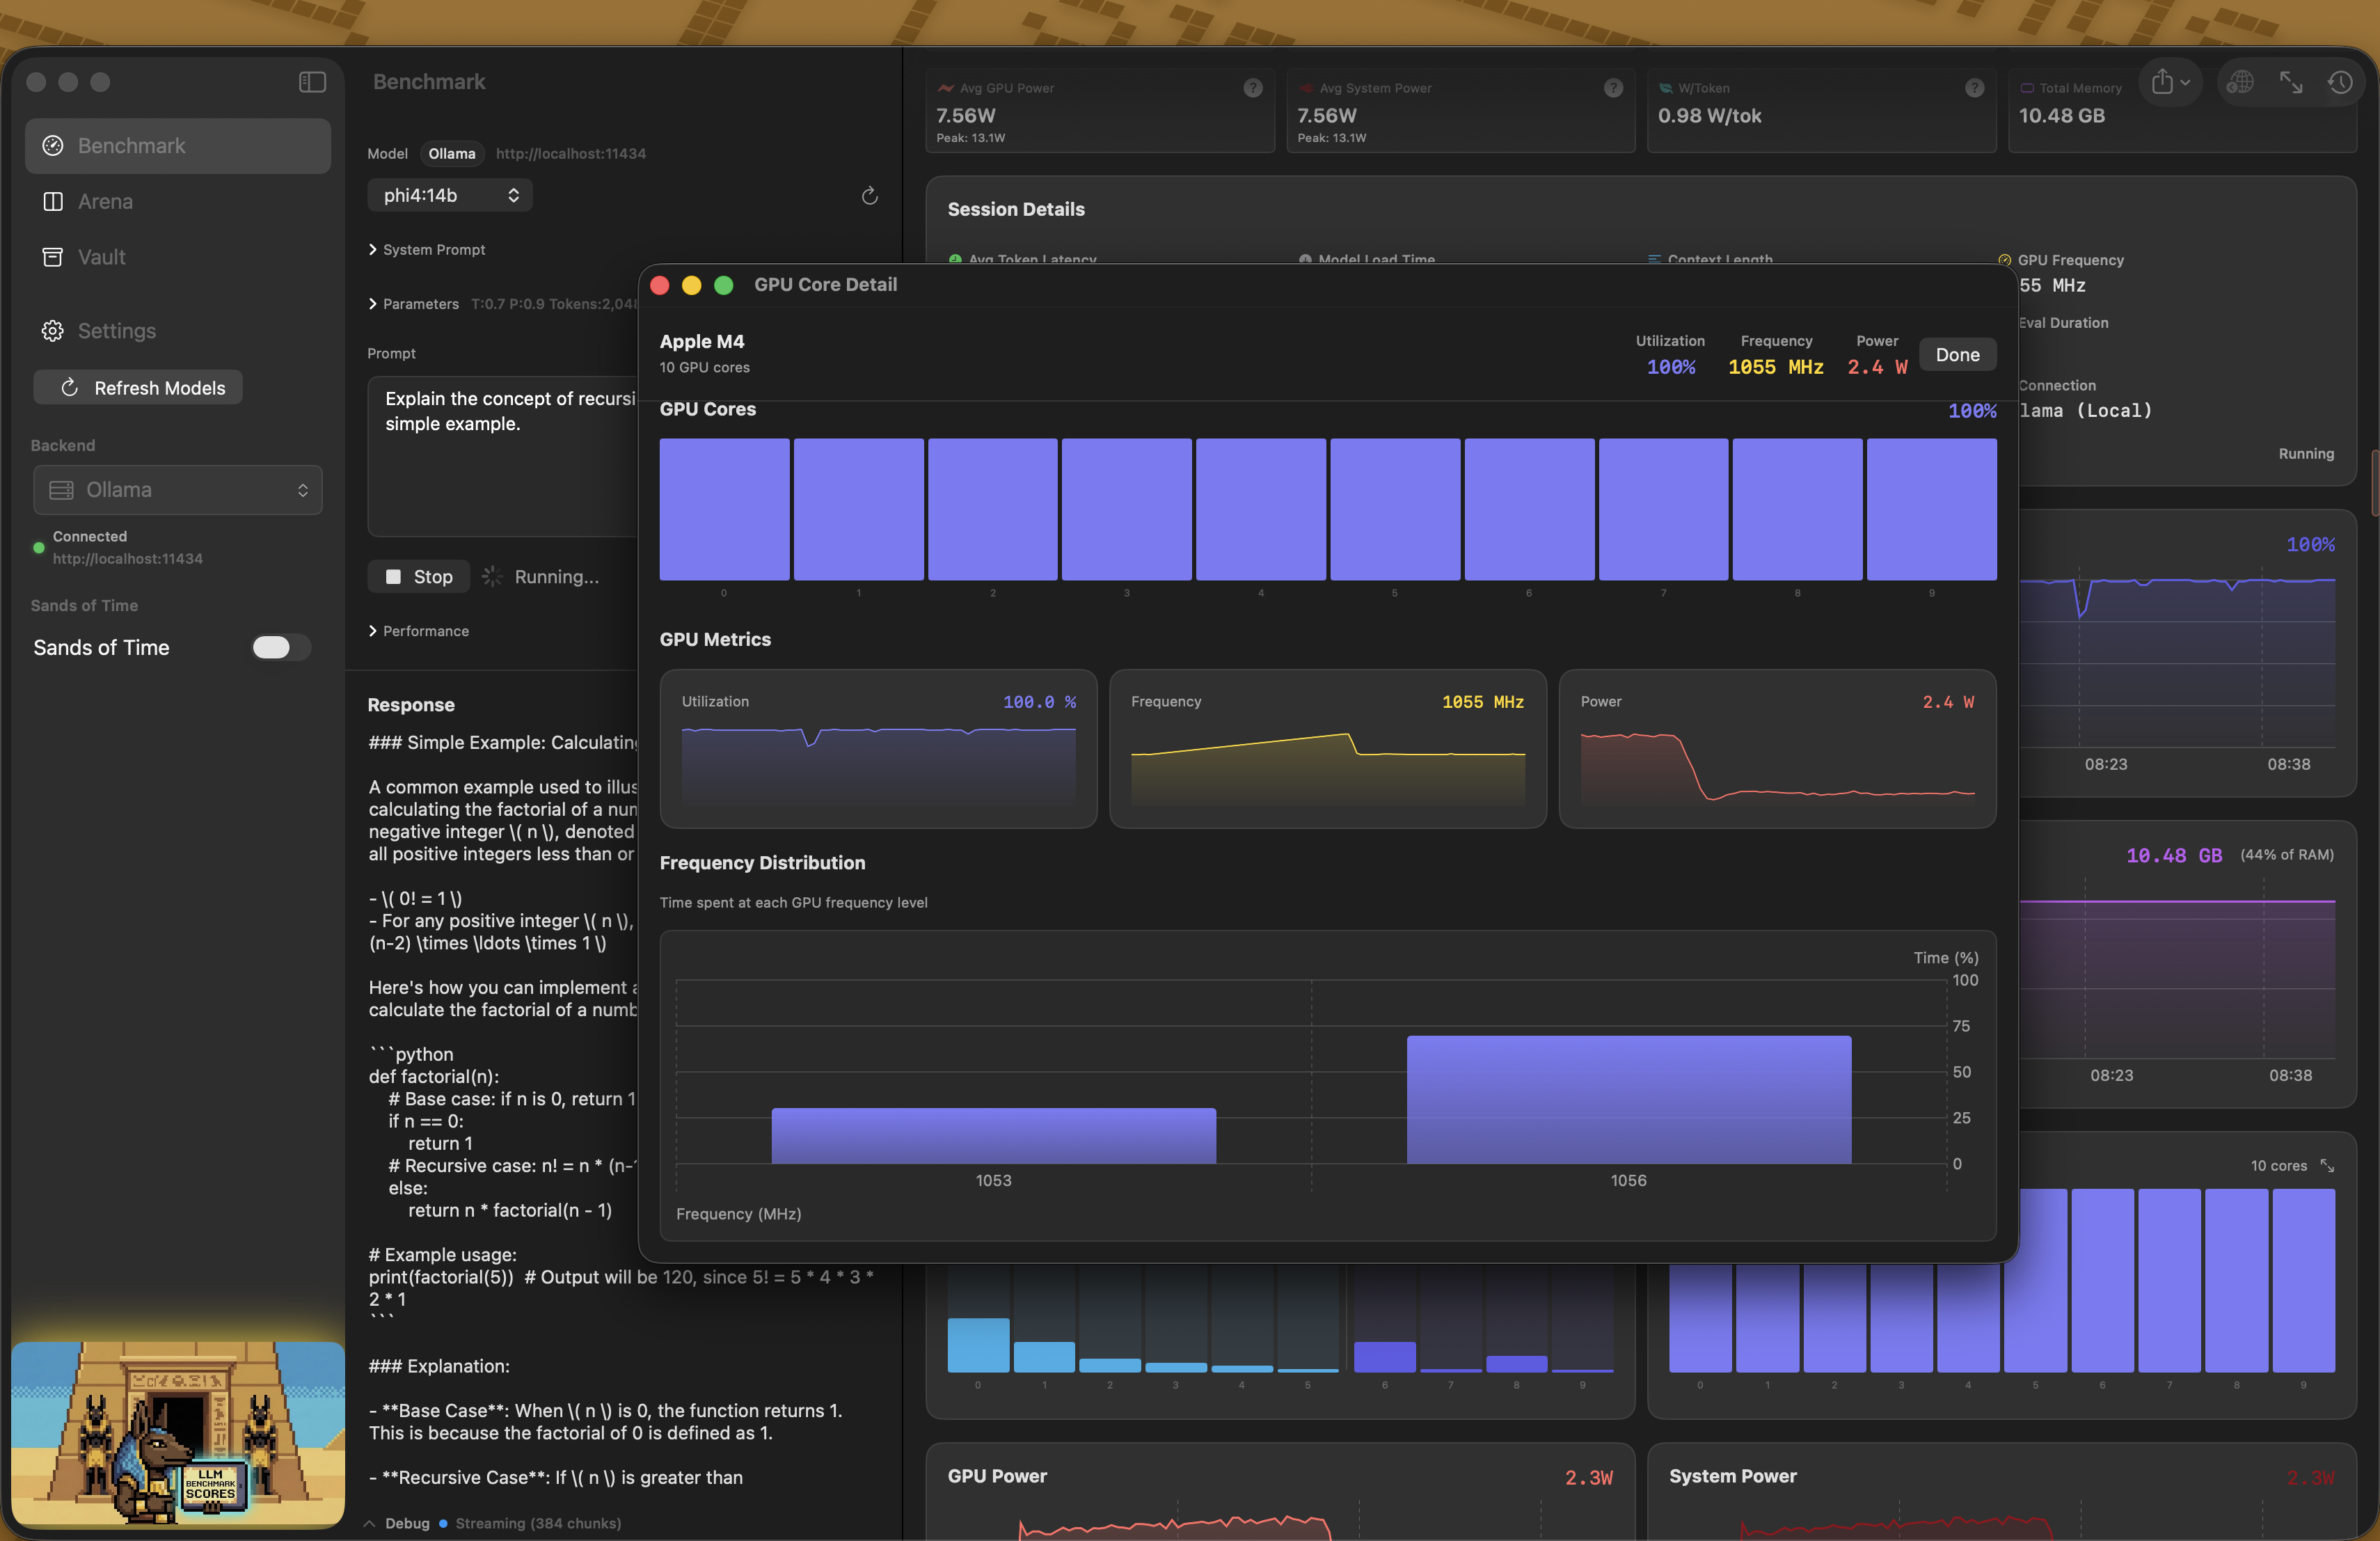
- 7 live charts: Tokens/sec, GPU utilization, CPU utilization, process memory, GPU/CPU/ANE/DRAM power, GPU frequency - all updating in real time
- Power telemetry: Real-time GPU, CPU, ANE, and DRAM power consumption in watts via IOReport
- Process monitoring: Auto-detects backend process by port (Ollama, LM Studio, mlx-lm, vLLM, etc.) with manual process picker
- Reasoning-aware: Output tok/s excludes thinking time; reasoning tok/s and prefill tok/s tracked separately for thinking models like DeepSeek-R1 and Qwen3-thinking
- Detailed session stats: output tok/s (excludes reasoning), prefill tok/s, peak tok/s, TTFT, model load time, context length, eval duration, power averages
- Configurable parameters: temperature, top-p, max tokens, system prompt
- 15 prompt presets organized by category (Reasoning, Coding, Creative, Knowledge, Instruction)
- Session history with full replay, CSV export, and Markdown reports
- 3-column expanded dashboard: Full-screen metrics view showing all charts without scrolling - system info, utilization, cores, power, and frequency at a glance
- Image export: Copy to clipboard, save as PNG, or share - 2x retina rendering with watermark, respects light/dark mode
- Smart URL handling: Auto-strips
/v1suffix from backend URLs to prevent double-pathing errors
Arena
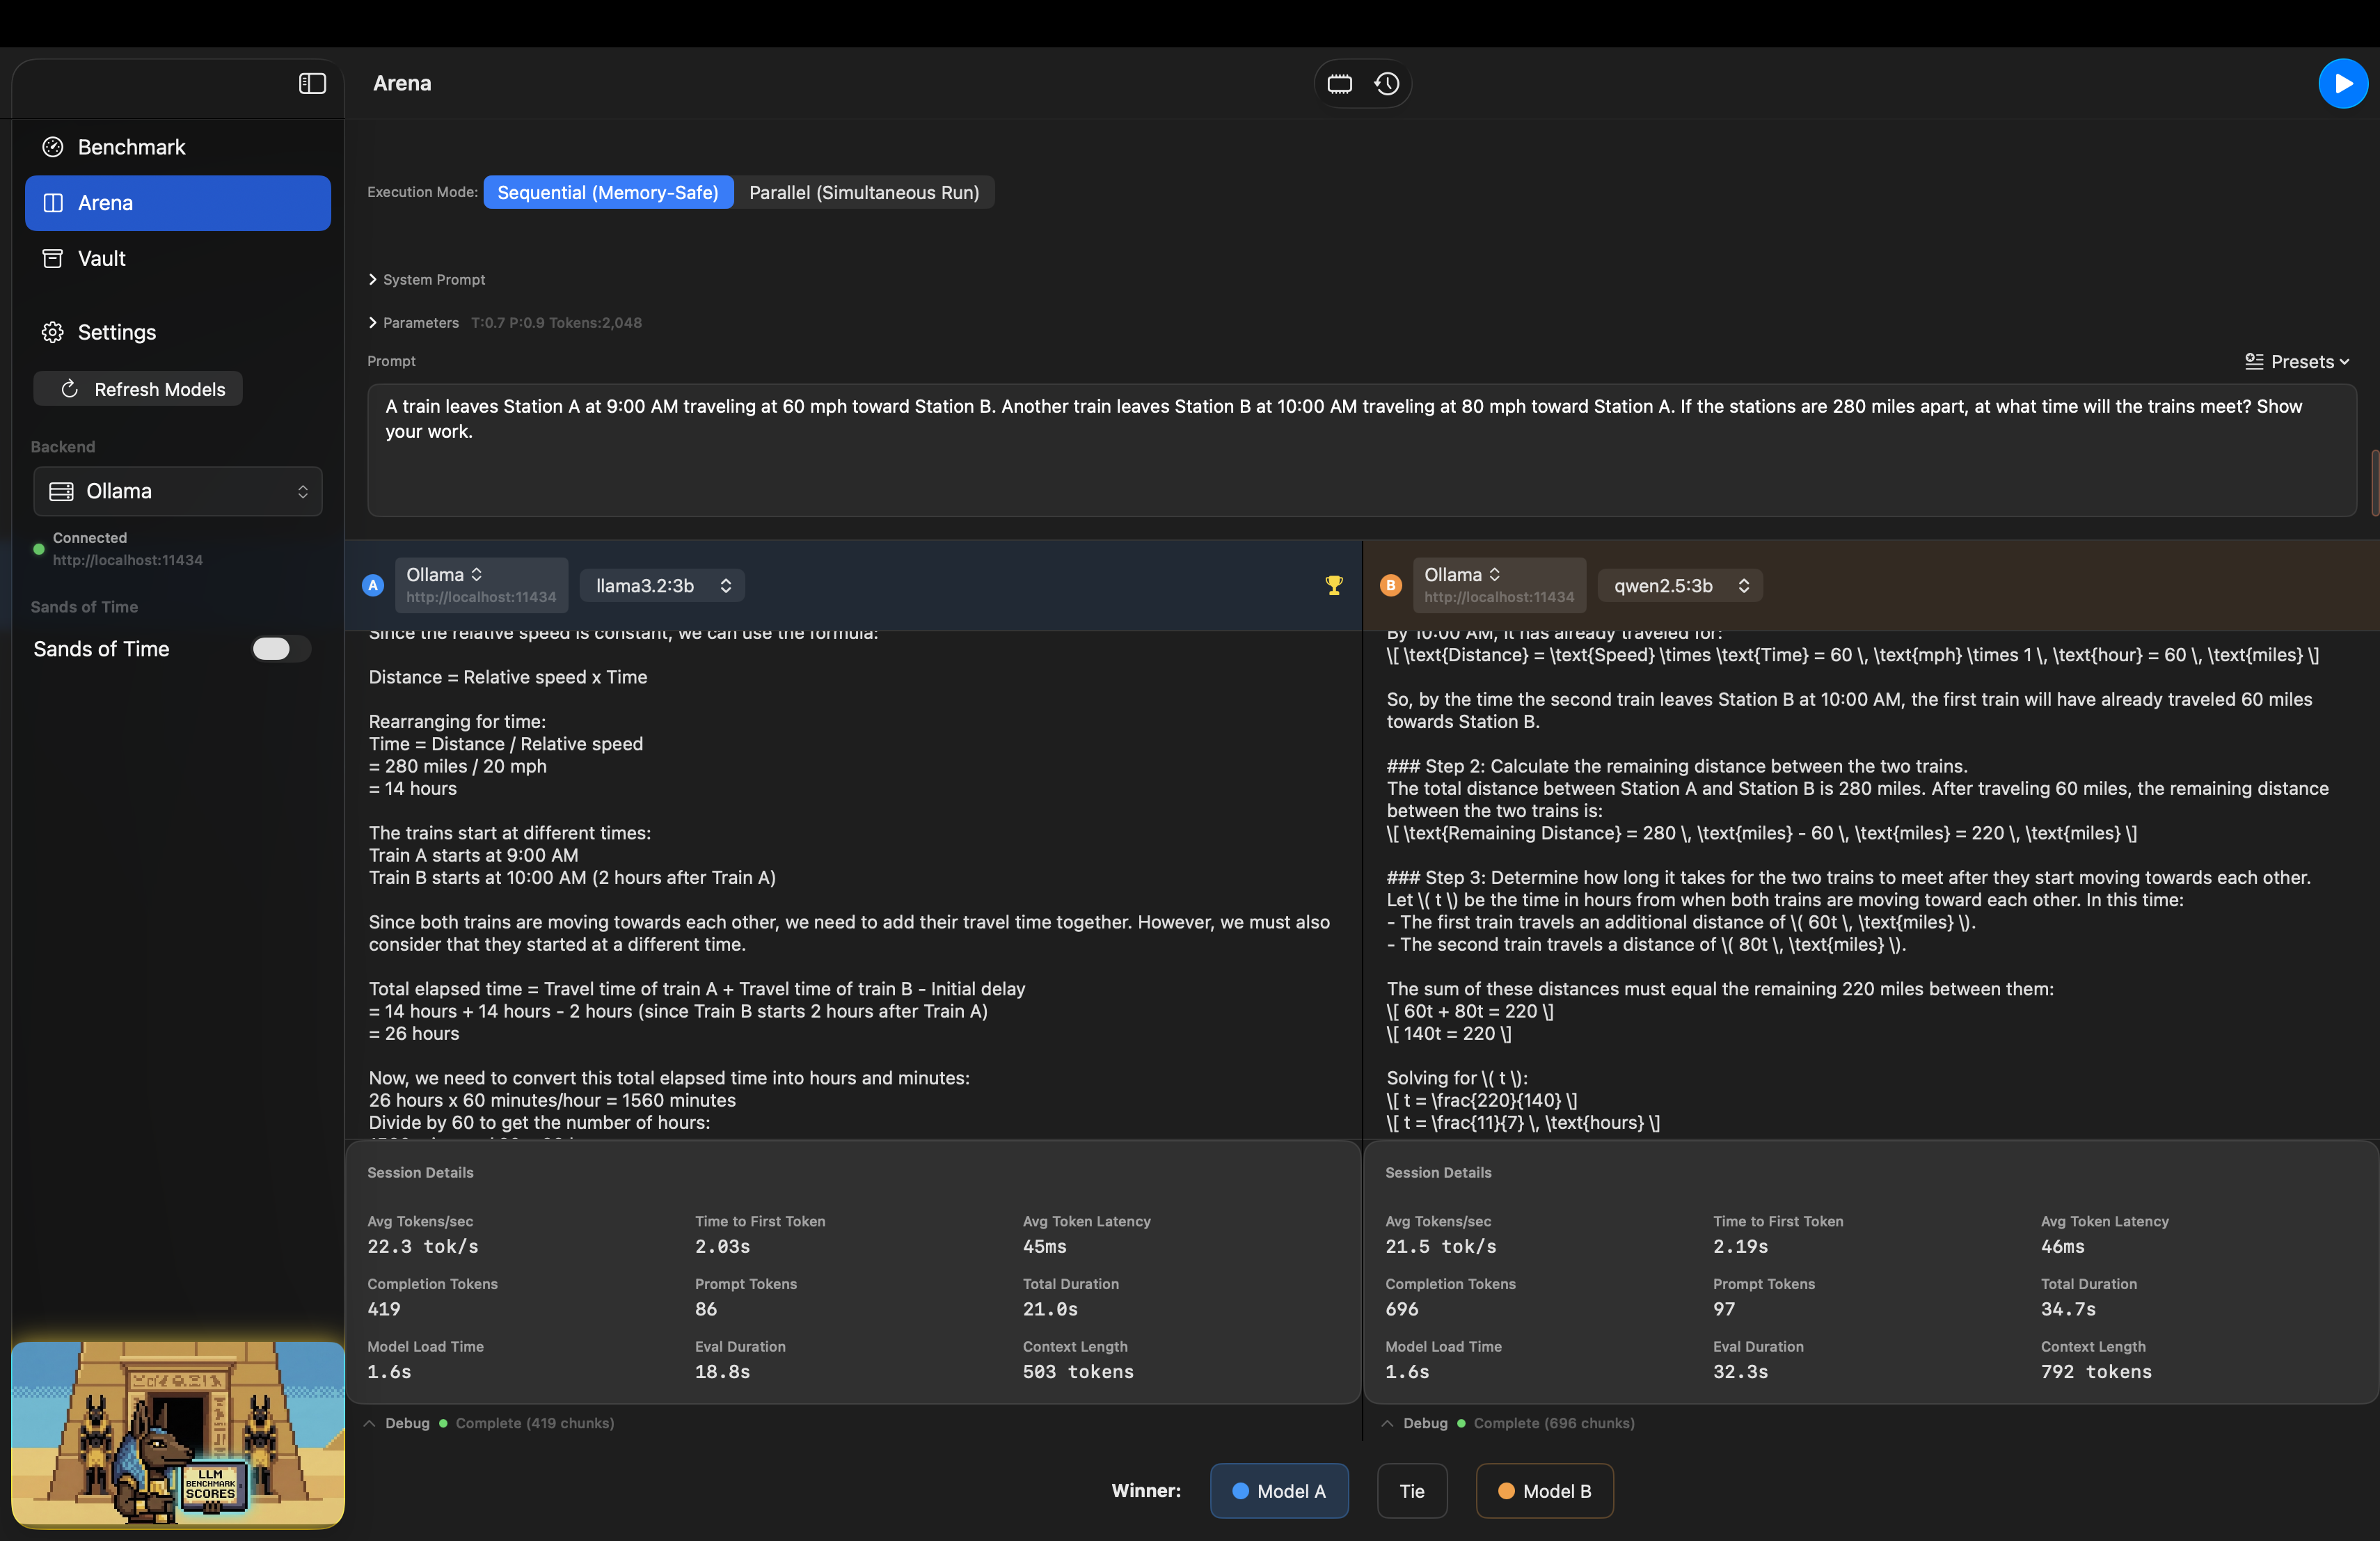
Side-by-side A/B model comparison with the same prompt.
- Dual model selectors with independent backend selection
- Sequential mode (memory-safe, one at a time) or Parallel mode (both simultaneously)
- Shared prompt, system prompt, and generation parameters
- Real-time streaming in both panels
- Voting system: pick Model A, Model B, or Tie - votes are persisted
- Per-panel stats grid (9 metrics each)
- Model manager: view loaded models and unload to free memory
- Comparison history with voting records
Flows
Drag-and-drop sequencer for repeatable, multi-step benchmark recipes.
- Shortcuts-style editor with three panes: palette · step list · inspector. Drag a step from the palette into any slot, or click to append.
- 12 step types: Set Backend / Model / Prompt / Parameters, Run Benchmark, Repeat × N, For Each Model, For Each Prompt, Unload Model, Reset Connection, Cool Down (fixed or thermal), Annotate
- Containers nest and multiply —
2 models × 3 prompts × 5 reps = 30 runsshown live in the header chip - Live lint flags dangling Set steps, empty For Each lists, missing prerequisites, and other common mistakes before you run
- 6 built-in templates: Quick Smoke Test, Repeated Run (5×), Cold vs Warm Start, Multi-Model Comparison, Q4 vs Q8 Quantization, Prompt Variants
- Run sheet with per-step progress, live log, "Run X of Y" counter, and a Stop (⌘.) that cancels cleanly
- Share-ready reports: 1920×1080 (16:9) or 1080×1080 (1:1) PNG cards with leaderboard + per-rep tables + methodology footer. Save at 2× retina or copy to clipboard. CSV export of per-model rows.
.anubisflowimport / export — versioned JSON, portable between machines- Run History sidebar lists past flow runs; one click reopens the report
- Help sheet (
?in the sidebar header) covers the editor, every step type, and For Each rules with worked examples
System Monitor
Standalone real-time hardware monitoring dashboard - no benchmark required.
- One-click start: Begin recording CPU, GPU, memory, power, and thermal metrics
- 3-column live dashboard: All charts visible at once - CPU/GPU utilization, memory, per-core grids, power breakdown, GPU frequency
- Stress testing: CPU, GPU (Mandelbrot), and memory bandwidth stress tests with adjustable intensity
- Floating HUD: Detach a compact always-on-top metrics overlay while you work
- Accumulating charts: Data builds up over time with automatic downsampling for long sessions
- System info card: Live readouts for CPU %, GPU %, memory, power draw, and thermal state
- No persistence: Data lives in memory only - nothing is saved when the monitor is closed
Leaderboard
Upload your benchmark results to the community leaderboard and see how your Mac stacks up against other Apple Silicon machines.
- One-click upload from the benchmark toolbar after a completed run
- Community rankings sorted by output tok/s with full drill-down into performance, power, and hardware details
- Three throughput metrics per row: output tok/s, prefill tok/s, and reasoning tok/s — see exactly where each model spends its time
- Model quantization & format tracking - every submission records the quantization level (Q4_K_M, FP16, 4-bit, etc.) and model format (GGUF vs MLX) so you can compare apples to apples
- Filter by chip, model, quantization, or format to compare like-for-like
- Data Explorer - interactive pivot table and charting powered by FINOS Perspective
- Privacy-first: no accounts, no response text uploaded - just metrics and a display name
- HMAC-signed submissions with server-side rate limiting
Vault
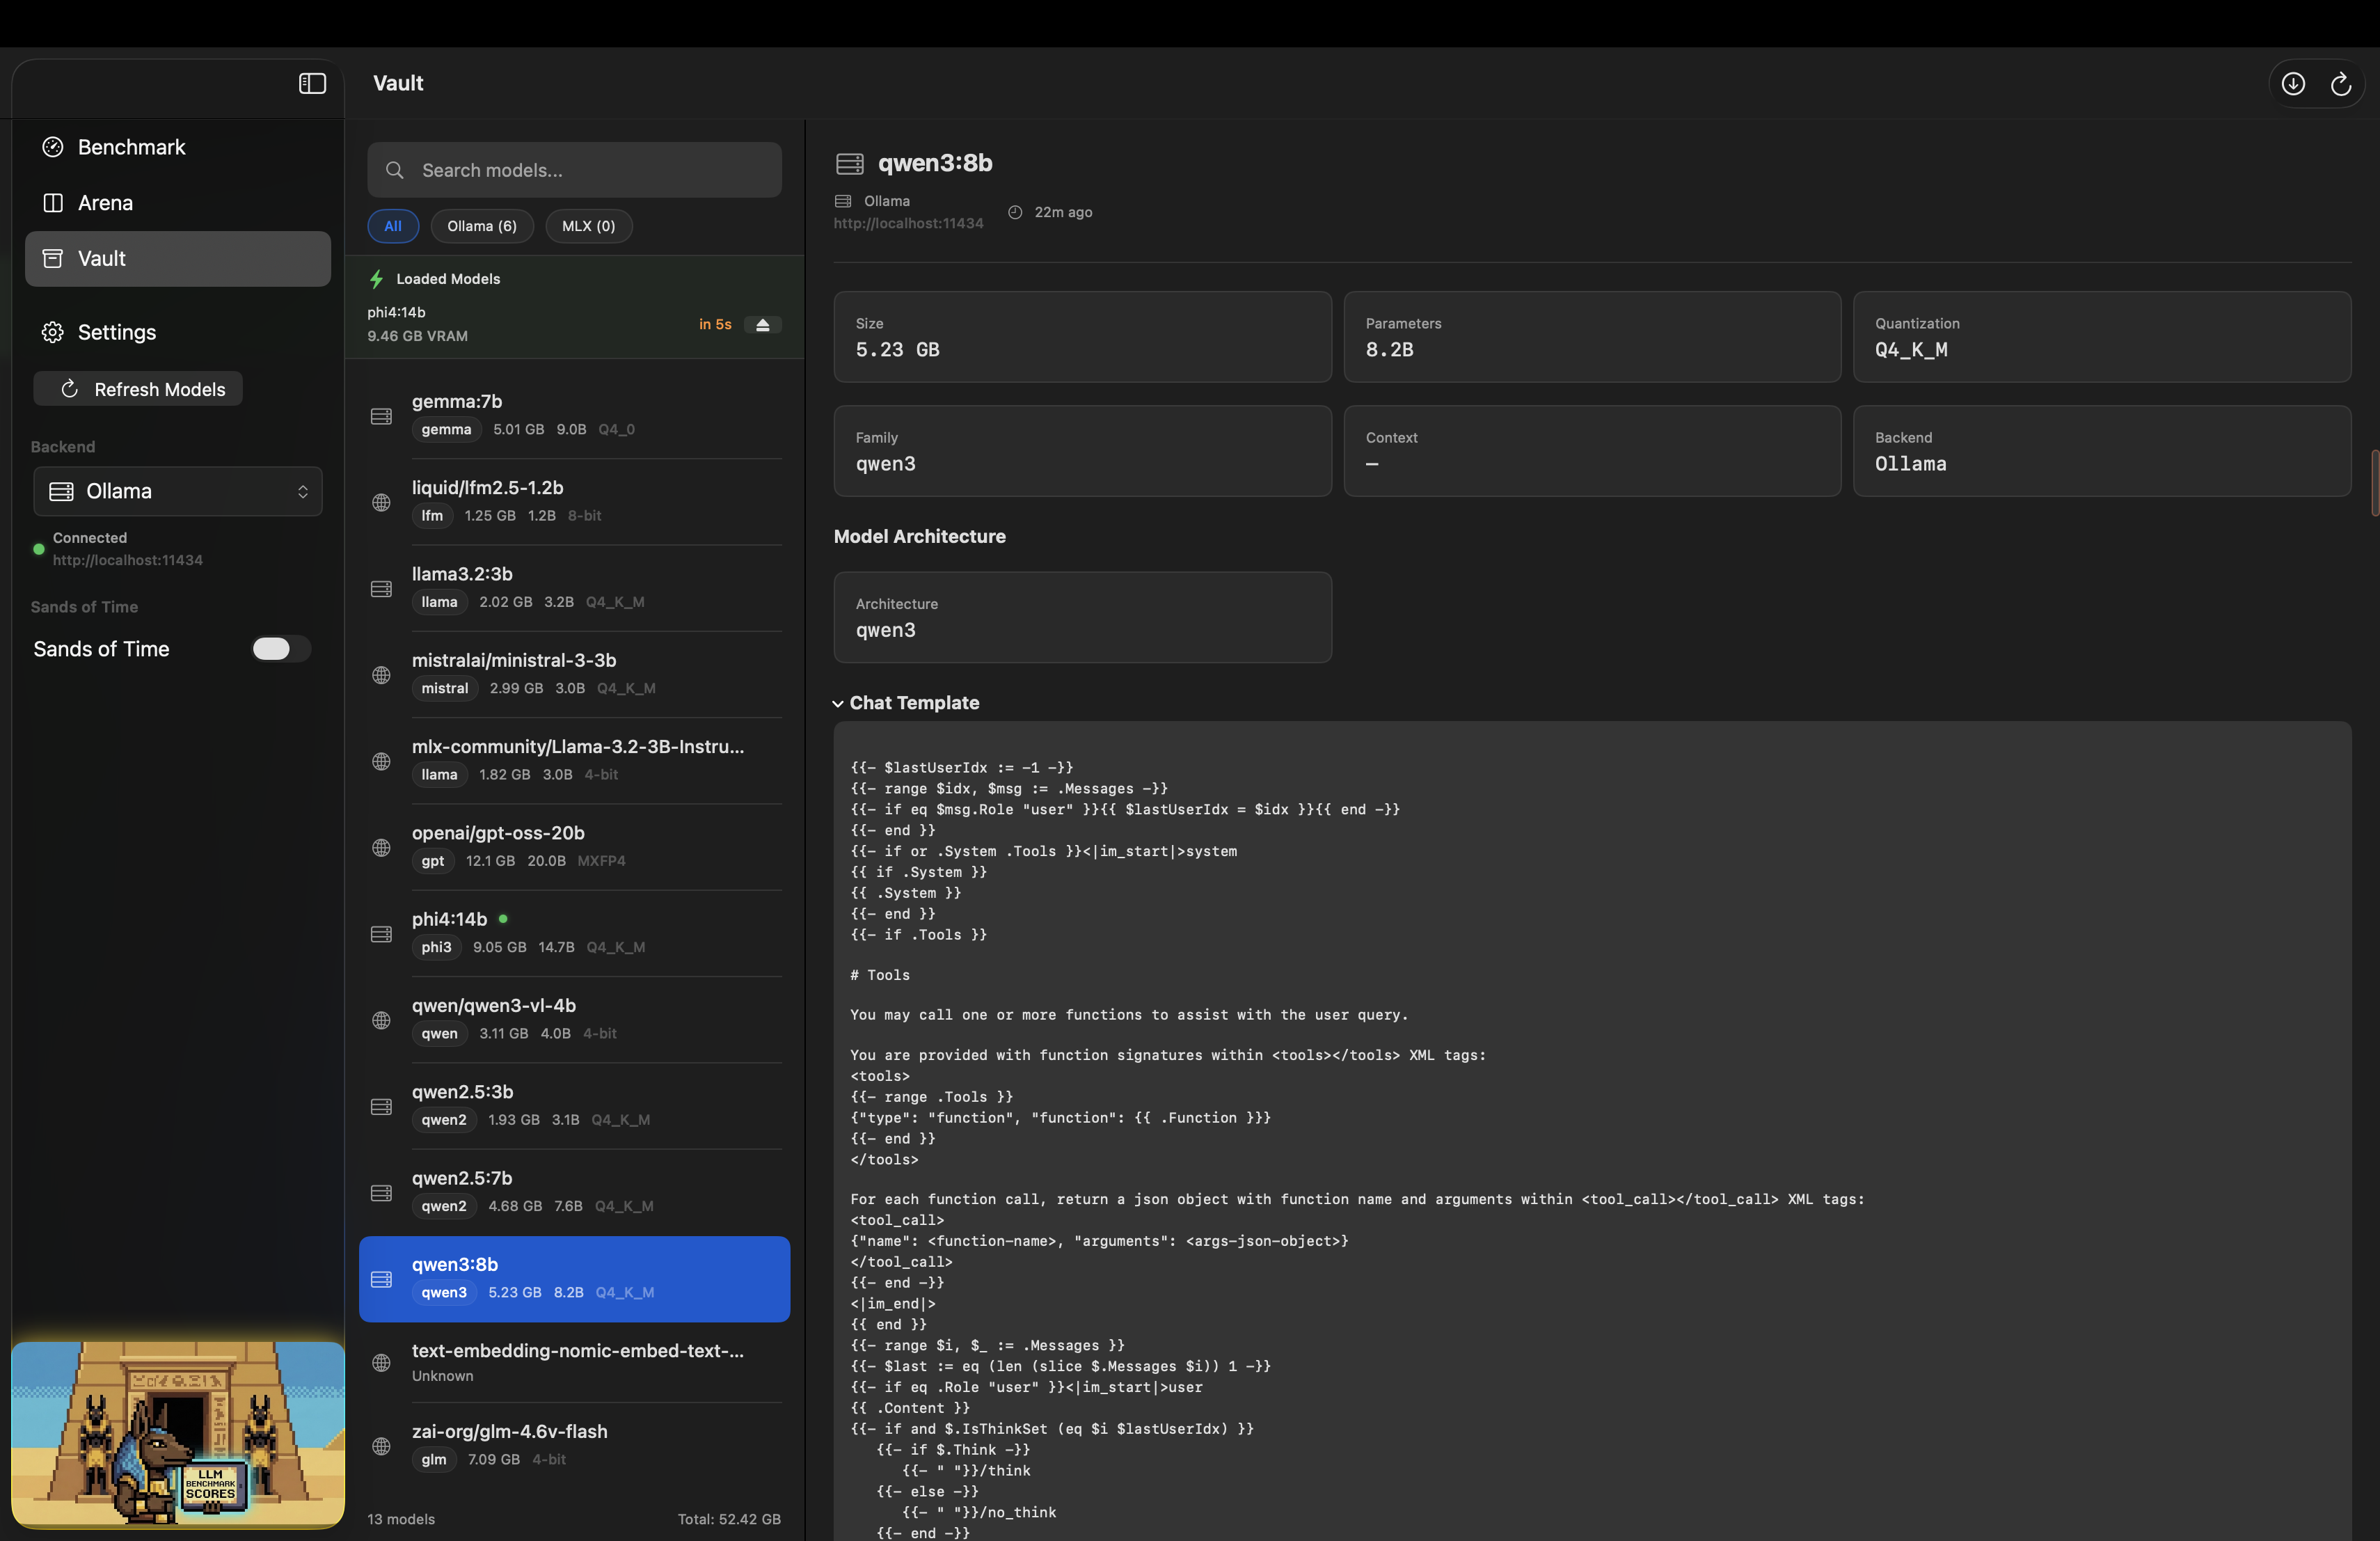
Unified model management across all backends.
- Aggregated model list with search and backend filter chips
- Running models section with live VRAM usage
- Model inspector: size, parameters, quantization, format (GGUF/MLX), family, context window, architecture details, file path
- Automatic metadata enrichment for OpenAI-compatible models - parses model IDs for family and parameter count, scans
~/.lmstudio/models/and~/.cache/huggingface/hub/for disk size, quantization, and path - Pull new models, delete existing ones, unload from memory
- Popular model suggestions for quick setup
- Total disk usage display
Auto-Update
Anubis checks for updates automatically via Sparkle and notifies you when a new version is available.
- Automatic checks on launch with user-controlled frequency
- Manual check via the app menu (Anubis OSS > Check for Updates...) or Settings > About
- Updates are code-signed, notarized, and verified with EdDSA before installation
Screenshots
Reports and Exports
GPU Core detail
Arena Mode
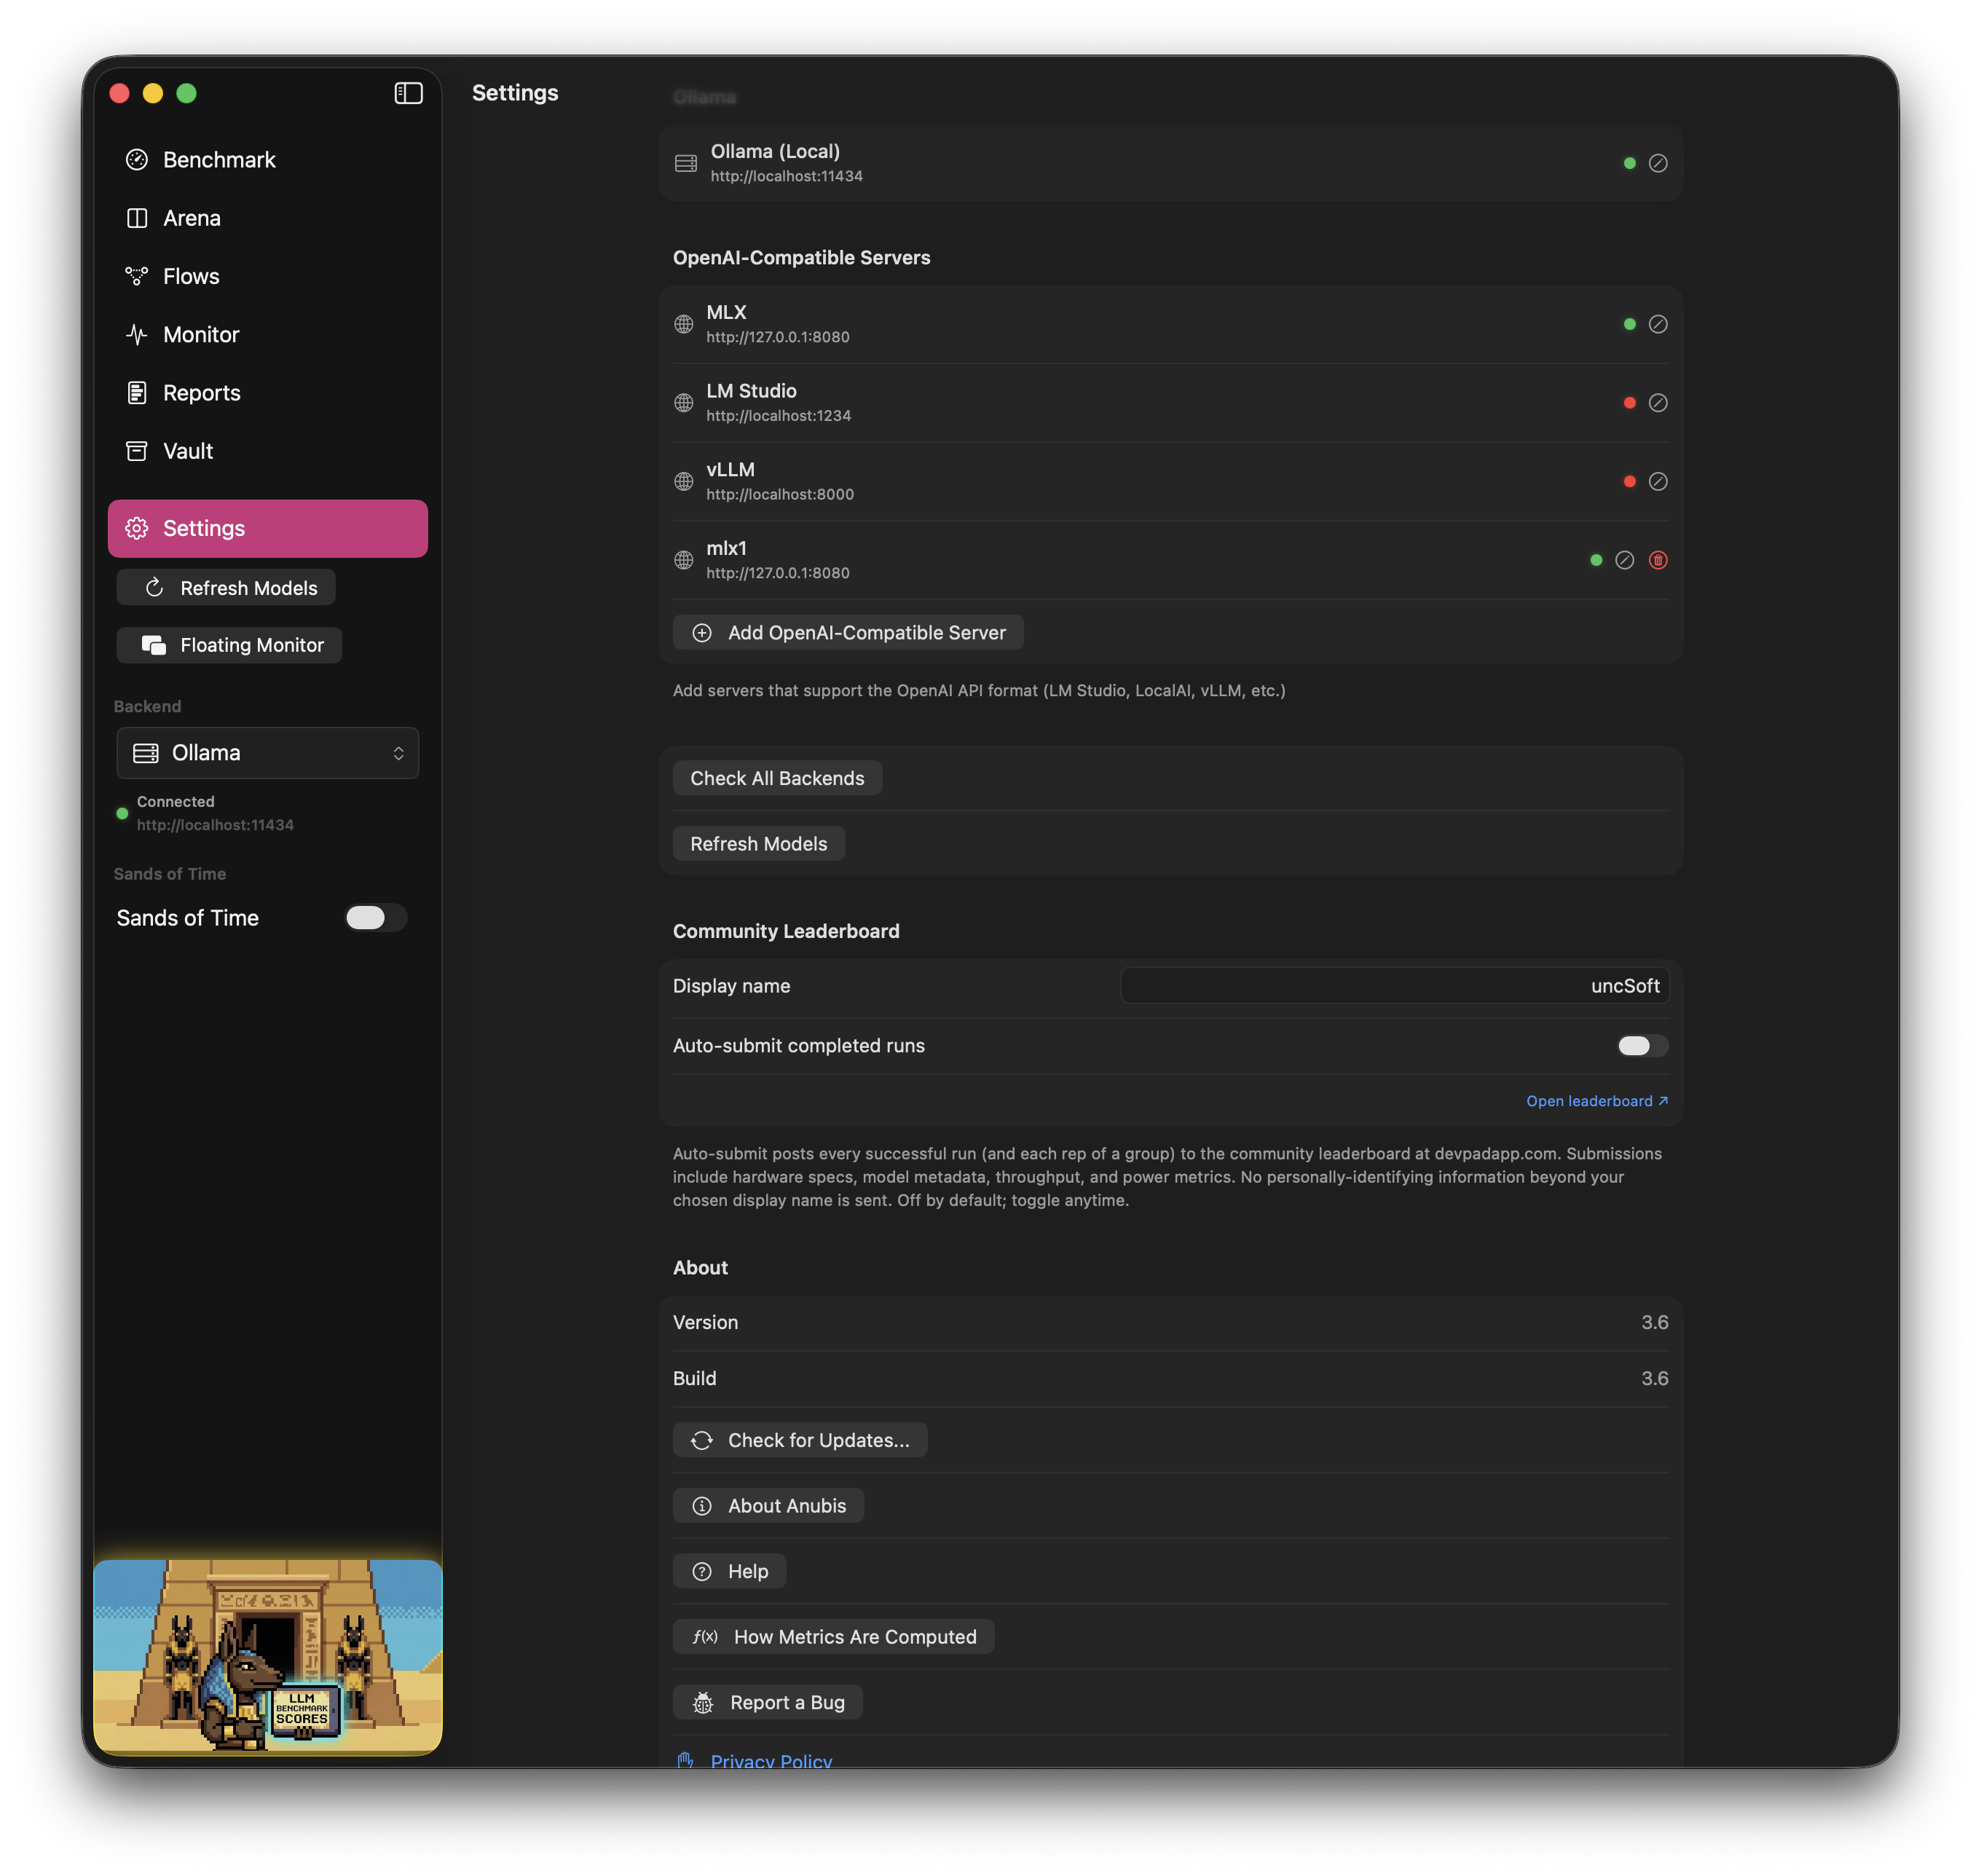
Settings (add connections with quick presets)
Vault - View model details, unload, and Pull models directly for Ollama
Supported Backends
| Backend | Type | Default Port | Setup |
|---|---|---|---|
| Apple Intelligence | On-device (Foundation Models) | — | macOS 26+ with Apple Intelligence enabled. No setup; appears in the backend menu when supported. |
| Ollama | Native support | 11434 | Install from ollama.com - auto-detected on launch |
| LM Studio | OpenAI-compatible | 1234 | Enable local server in LM Studio settings |
| mlx-lm | OpenAI-compatible | 8080 | pip install mlx-lm && mlx_lm.server --model <model> |
| vLLM | OpenAI-compatible | 8000 | Add in Settings |
| LocalAI | OpenAI-compatible | 8080 | Add in Settings |
| Docker ModelRunner | OpenAI-compatible | user selected | Add in Settings |
Any OpenAI-compatible server can be added through Settings > Add OpenAI-Compatible Server with a name, URL, and optional API key.
Hardware Metrics
Anubis captures Apple Silicon telemetry during inference via IOReport and system APIs:
| Metric | Source | Description |
|---|---|---|
| GPU Utilization | IOReport | GPU active residency percentage |
| CPU Utilization | host_processor_info |
Usage across all cores |
| GPU Power | IOReport Energy Model | GPU power consumption in watts |
| CPU Power | IOReport Energy Model | CPU (E-cores + P-cores) power in watts |
| ANE Power | IOReport Energy Model | Neural Engine power consumption |
| DRAM Power | IOReport Energy Model | Memory subsystem power |
| GPU Frequency | IOReport GPU Stats | Weighted average from P-state residency |
| Process Memory | proc_pid_rusage |
Backend process phys_footprint (includes Metal/GPU allocations) |
| Thermal State | ProcessInfo.thermalState |
System thermal pressure level |
Process Monitoring
Anubis automatically detects which process is serving your model:
- Port-based detection: Uses
lsofto find the PID listening on the inference port (called once per benchmark start) - Backend identification: Matches process path and command-line args to identify Ollama, LM Studio, mlx-lm, vLLM, LocalAI, llama.cpp
- Memory accounting: Uses
phys_footprint(same as Activity Monitor) which includes Metal/GPU buffer allocations - critical for MLX and other GPU-accelerated backends - LM Studio support: Walks Electron app bundle descendants to find the model-serving process
- Manual override: Process picker lets you select any process by name, sorted by memory usage
Metrics degrade gracefully - if IOReport access is unavailable (e.g., in a VM), Anubis still shows inference-derived metrics.
Requirements
- macOS 15.0 (Sequoia) or later
- Apple Silicon (M1 / M2 / M3 / M4 / M5 +) - Intel is not supported
- 8 GB unified memory minimum (16 GB+ recommended for larger models)
- At least one inference backend installed (Ollama recommended)
Getting Started
1. Install Ollama (or another backend)
# macOS - install Ollama
brew install ollama

# Start the server
ollama serve

# Pull a model
ollama pull llama3.2:3b
2. Install Anubis
The easiest path is Homebrew — installs the signed, notarized .app from the latest GitHub release:
brew install --cask uncsoft/anubis/anubis-oss
Or download the zip directly from the Releases page and drag to /Applications.
Anubis auto-updates via Sparkle in either case. Once installed, Anubis will auto-detect Ollama on launch. Other backends can be added in Settings.
Updating to a new version
The app updates itself via Sparkle — just open Anubis and accept the update prompt (or Settings → Check for Updates). That's the recommended path and works for every install method.
To update through Homebrew instead:
brew update
brew upgrade --cask anubis-oss --greedy
Homebrew saysThe
--greedyflag is required because the cask is markedauto_updates(the app updates itself), so a plainbrew upgradeintentionally skips it.
Cask 'anubis-oss' is unreadable: syntax errors / shows <<<<<<< conflict markers
This only happens if your local tap checkout has uncommitted edits or a stash that conflicts with an update. Reset it to the published cask:
cd "$(brew --repository)/Library/Taps/uncsoft/homebrew-anubis"
git fetch origin && git reset --hard origin/main
brew upgrade --cask anubis-oss --greedy
Or build from source
git clone https://github.com/uncSoft/anubis-oss.git
cd anubis-oss/anubis
open anubis.xcodeproj
In Xcode:
1. Set your development team in Signing & Capabilities
2. Build and run (Cmd+R)
3. Run Your First Benchmark
- Select a model from the dropdown
- Type a prompt or pick one from Presets
- Click Run
- Watch the metrics light up in real time
4. Submit to the Leaderboard
After a benchmark completes, click the Upload button in the benchmark toolbar to submit your results to the community leaderboard. Enter a display name and your run will appear in the rankings - no account required. Only performance metrics and hardware info are submitted; response text is never uploaded.
Building from Source
# Clone
git clone https://github.com/uncSoft/anubis-oss.git
cd anubis-oss/anubis

# Build via command line
xcodebuild -scheme anubis-oss -configuration Debug build

# Run tests
xcodebuild -scheme anubis-oss -configuration Debug test

# Or just open in Xcode
open anubis.xcodeproj
Dependencies
Resolved automatically by Swift Package Manager on first build:
| Package | Purpose | License |
|---|---|---|
| GRDB.swift | SQLite database | MIT |
| Sparkle | Auto-update framework | MIT |
| Swift Charts | Data visualization | Apple |
Architecture
Anubis follows MVVM with a layered service architecture:
┌─────────────────────────────────────────────────────────────┐
│                    PRESENTATION LAYER                       │
│  BenchmarkView  ArenaView  MonitorView  VaultView  Settings │
├─────────────────────────────────────────────────────────────┤
│                      SERVICE LAYER                          │
│   MetricsService   InferenceService   ModelService   Export │
├─────────────────────────────────────────────────────────────┤
│                    INTEGRATION LAYER                        │
│  OllamaClient  OpenAICompatibleClient  IOReportBridge  ProcessMonitor │
├─────────────────────────────────────────────────────────────┤
│                    PERSISTENCE LAYER                        │
│   SQLite (GRDB)              File System                    │
└─────────────────────────────────────────────────────────────┘
Views display data and delegate to ViewModels. ViewModels coordinate Services. Services are stateless and use async/await. Integrations are thin adapters wrapping external systems (Ollama API, IOReport, etc.).
Project Structure
anubis/
├── App/                    # Entry point, app state, navigation
├── Features/
│   ├── Benchmark/          # Performance dashboard
│   ├── Arena/              # A/B model comparison
│   ├── Flows/              # Flow Builder: editor, executor, report, lint, templates
│   ├── Monitor/            # System monitor, stress tests, floating HUD
│   ├── Reports/            # Cross-run model performance table
│   ├── Vault/              # Model management
│   └── Settings/           # Backend config, about, help, contact
├── Services/               # MetricsService, InferenceService, FlowExecutor, ExportService
├── Integrations/           # OllamaClient, OpenAICompatibleClient, IOReportBridge, ProcessMonitor
├── Models/                 # Data models (BenchmarkSession, Flow, ModelInfo, etc.)
├── Database/               # GRDB setup & migrations
├── DesignSystem/           # Theme, colors, reusable components
├── Demo/                   # Demo mode for App Store review
└── Utilities/              # Formatters, constants, logger, benchmark prompts
Backend Abstraction
All inference backends implement a shared protocol, making it straightforward to add new ones:
protocol InferenceBackend {
    var id: String { get }
    var displayName: String { get }
    var isAvailable: Bool { get async }

    func listModels() async throws -> [ModelInfo]
    func generate(prompt: String, parameters: GenerationParameters)
        -> AsyncThrowingStream<InferenceChunk, Error>
}
Data Storage
All data is stored locally - nothing leaves your machine.
| Data | Location |
|---|---|
| Database | ~/Library/Application Support/Anubis/anubis.db |
| Exports | Generated on demand (CSV, Markdown) |
| Preferences | UserDefaults |
Troubleshooting
Ollama shows "Disconnected"
# Make sure Ollama is running
ollama serve

# Verify it's accessible
curl http://localhost:11434/api/tags
No GPU metrics
- GPU metrics require IOReport access via IOKit
- Some configurations or VMs may not expose these APIs
- Anubis will still show inference-derived metrics (tokens/sec, TTFT, etc.)
High memory usage
- Use Sequential mode in Arena to run one model at a time
- Unload unused models via Arena > Models > Unload All
- Choose smaller quantized models (Q4_K_M over Q8_0)
Model not appearing
- Click Refresh Models in Settings
- Ensure the model is pulled:
ollama pull <model-name> - For OpenAI-compatible backends, verify the server is running and the URL is correct
Contributing
Contributions are welcome. A few guidelines:
- Follow the existing patterns - MVVM, async/await, guard-let over force-unwrap
- Keep files under 300 lines - split if larger
- One feature per PR - small, focused changes are easier to review
- Test services and integrations - views are harder to unit test, but services should have coverage
- Handle errors gracefully - always provide
errorDescriptionandrecoverySuggestion
Adding a New Backend
- Create a new file in
Integrations/implementingInferenceBackend - Register it in
InferenceService - Add configuration UI in
Settings/ - That's it - the rest of the app works through the protocol
Support the Project
If Anubis is useful to you, consider buying me a coffee on Ko-fi or sponsoring on GitHub. It helps fund continued development and new features.
A sandboxed, less feature rich version is also available on the Mac App Store if you prefer a managed install.
License
GPL-3.0 License - see LICENSE for details.